Download
1 / 22
230 likes | 428 Views
DATA HANDLING. Collection of numbers , when used to represent a certain quantity,forms a data. Examples :: marks obtained by 10 students 23,35,48,30,25,46,13,27,32,38 When all the numbers are listed in a data we call it a RAW DATA. RANGE OF A RAW DATA.

E N D
DATA HANDLING • Collection of numbers , when used to represent a certain quantity,forms a data. • Examples :: marks obtained by 10 students • 23,35,48,30,25,46,13,27,32,38 • When all the numbers are listed in a data we call it a RAW DATA
RANGE OF A RAW DATA • It is the difference between the highest and lowest values of the data. • In the following data, 24,42,32,85,19,36,15,63 Range =85 – 15= 70
OBSERVE THE FOLLOWING PICTOGRAPH ( 1SYMBOLS REPRESENTS 100 CARS )
11 10 9 8 7 6 Banana 5 No. of fruits Apple 4 Guava 3 Orange 2 1 Names of fruits
Consider the following data. Scale : 1unit = 5 marks Quarterly marks Half yearly marks Arun Marks Maya 25 Double Bar Graph Ashish Kavish Rita 20 15 10 5 Students
A Different form 21,10,30,22,33,5,37,12,25,42,15,39,26,32,18,27,28,19,29,35,31,24,36,18,20,38,22,44,16,24,10,27,39,28,49,29,32,23,31,21,34,22,23,36,24,36,33,47,48,50,39,20,7,16,36,45,47,30,22,17 Grouped Frequency Distribution Class Intervals Frequency
Class Intervals Lower limits Upper limits Continuous Class Intervals Upper Limits not included Width or ( size ) = Upper limit – Lower limit Size = 20 – 10 = 10
Histogram Graphical representation of grouped data
Class size 25 Highest frequency 140 Lowest frequency 20 Upper limit of the class 250 - 275 275 Lower limit of the class 125 - 150 125 Which two classes have the frequency ? 150 – 175 & 225 -- 250 To which class does the number 275 belong ? 275 -- 300
No. of students Bars of equal width with nogaps between them 10 30 5 40 9 4 50 3 8 12 10 60 7 2 20 11 1 6 Classes
CIRCLE GRAPHS PIE CHARTS
J INU ANU MANU MINU SONU TINU SONU
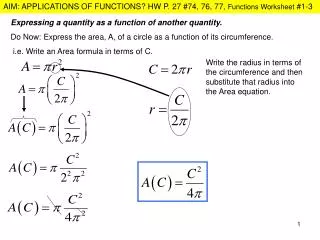
How to draw a pie chart? • Consider the following table.
CALCULATIONS = 30 360 x = 900 120 40 360 x = 120 1200 25 x 360 = 750 120 25 x 360 = 750 120 360 75
South Indian North Indian 1200 900 750 750 Others Chinese
EVALUATION • Time spent by a child during a day is given below • Draw a pie chart for the given data