Download
1 / 1
10 likes | 128 Views
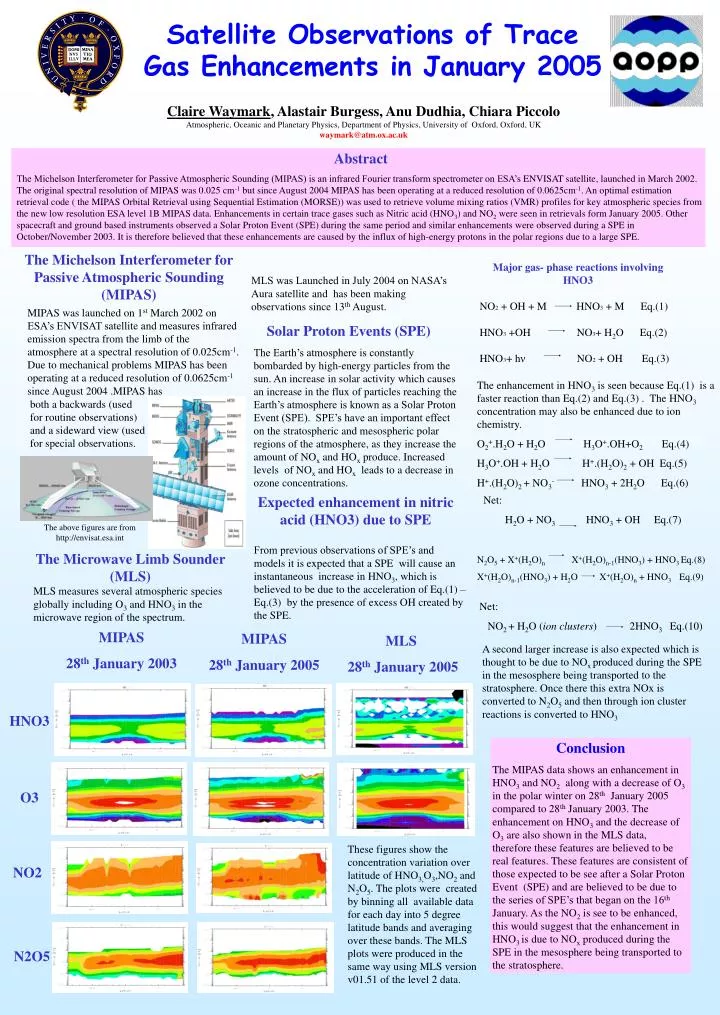
Satellite Observations of Trace Gas Enhancements in January 2005. Claire Waymark , Alastair Burgess, Anu Dudhia, Chiara Piccolo Atmospheric, Oceanic and Planetary Physics, Department of Physics, University of Oxford, Oxford, UK waymark@atm.ox.ac.uk. Abstract

E N D
Satellite Observations of Trace Gas Enhancements in January 2005 Claire Waymark, Alastair Burgess, Anu Dudhia, Chiara Piccolo Atmospheric, Oceanic and Planetary Physics, Department of Physics, University of Oxford, Oxford, UK waymark@atm.ox.ac.uk Abstract The Michelson Interferometer for Passive Atmospheric Sounding (MIPAS) is an infrared Fourier transform spectrometer on ESA’s ENVISAT satellite, launched in March 2002. The original spectral resolution of MIPAS was 0.025 cm-1 but since August 2004 MIPAS has been operating at a reduced resolution of 0.0625cm-1. An optimal estimation retrieval code ( the MIPAS Orbital Retrieval using Sequential Estimation (MORSE)) was used to retrieve volume mixing ratios (VMR) profiles for key atmospheric species from the new low resolution ESA level 1B MIPAS data. Enhancements in certain trace gases such as Nitric acid (HNO3) and NO2 were seen in retrievals form January 2005. Other spacecraft and ground based instruments observed a Solar Proton Event (SPE) during the same period and similar enhancements were observed during a SPE in October/November 2003. It is therefore believed that these enhancements are caused by the influx of high-energy protons in the polar regions due to a large SPE. The Michelson Interferometer for Passive Atmospheric Sounding (MIPAS) Major gas- phase reactions involving HNO3 NO2 + OH + M HNO3 + M Eq.(1) HNO3 +OH NO3+ H2O Eq.(2) HNO3+ hν NO2 + OH Eq.(3) MLS was Launched in July 2004 on NASA’s Aura satellite and has been making observations since 13th August. MIPAS was launched on 1st March 2002 on ESA’s ENVISAT satellite and measures infrared emission spectra from the limb of the atmosphere at a spectral resolution of 0.025cm-1. Due to mechanical problems MIPAS has been operating at a reduced resolution of 0.0625cm-1 since August 2004 .MIPAS has Solar Proton Events (SPE) The Earth’s atmosphere is constantly bombarded by high-energy particles from the sun. An increase in solar activity which causes an increase in the flux of particles reaching the Earth’s atmosphere is known as a Solar Proton Event (SPE). SPE’s have an important effect on the stratospheric and mesospheric polar regions of the atmosphere, as they increase the amount of NOx and HOx produce. Increased levels of NOx and HOx leads to a decrease in ozone concentrations. The enhancement in HNO3 is seen because Eq.(1) is a faster reaction than Eq.(2) and Eq.(3) . The HNO3 concentration may also be enhanced due to ion chemistry. O2+.H2O + H2O H3O+.OH+O2 Eq.(4) H3O+.OH + H2O H+.(H2O)2 + OH Eq.(5) H+.(H2O)2 + NO3- HNO3 + 2H2O Eq.(6) N2O5 + X+(H2O)n X+(H2O)n-1(HNO3) + HNO3 Eq.(8) X+(H2O)n-1(HNO3) + H2O X+(H2O)n + HNO3 Eq.(9) both a backwards (used for routine observations) and a sideward view (used for special observations. Expected enhancement in nitric acid (HNO3) due to SPE Net: H2O + NO3 HNO3 + OH Eq.(7) The above figures are from http://envisat.esa.int From previous observations of SPE’s and models it is expected that a SPE will cause an instantaneous increase in HNO3, which is believed to be due to the acceleration of Eq.(1) – Eq.(3) by the presence of excess OH created by the SPE. The Microwave Limb Sounder (MLS) MLS measures several atmospheric species globally including O3 and HNO3 in the microwave region of the spectrum. Net: NO2+ H2O (ion clusters) 2HNO3Eq.(10) MIPAS 28th January 2003 MIPAS 28th January 2005 MLS 28th January 2005 A second larger increase is also expected which is thought to be due to NOx produced during the SPE in the mesosphere being transported to the stratosphere. Once there this extra NOx is converted to N2O5 and then through ion cluster reactions is converted to HNO3 HNO3 Conclusion The MIPAS data shows an enhancement in HNO3 and NO2 along with a decrease of O3 in the polar winter on 28th January 2005 compared to 28th January 2003. The enhancement on HNO3 and the decrease of O3 are also shown in the MLS data, therefore these features are believed to be real features. These features are consistent of those expected to be see after a Solar Proton Event (SPE) and are believed to be due to the series of SPE’s that began on the 16th January. As the NO2 is see to be enhanced, this would suggest that the enhancement in HNO3 is due to NOx produced during the SPE in the mesosphere being transported to the stratosphere. O3 These figures show the concentration variation over latitude of HNO3,O3,NO2 and N2O5. The plots were created by binning all available data for each day into 5 degree latitude bands and averaging over these bands. The MLS plots were produced in the same way using MLS version v01.51 of the level 2 data. NO2 N2O5