Download
1 / 13
200 likes | 371 Views
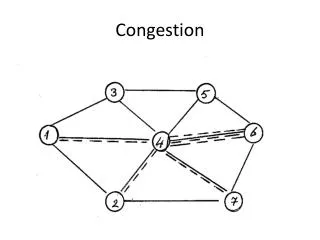
London Congestion Charging. Central London Congestion Charging Zone. Average daily traffic entering charging zone *. Congestion Charging led to a dramatic and immediate reduction in the volumes of traffic in central London – and profoundly changed the pattern of vehicles seen

E N D
Average daily traffic entering charging zone* Congestion Charging led to a dramatic and immediate reduction in the volumes of traffic in central London – and profoundly changed the pattern of vehicles seen Six years on, the impact on traffic levels is even more pronounced than when the scheme was first introduced Normally Charge Paying Normally Non-Charge Paying * During charging hours (07.00-18.00)
Congestion levels in charging zone -0% -4% -8% -8% -22% 2.1 min/km -30% * Moving car observer surveys - during charging hours (07.00-18.00)
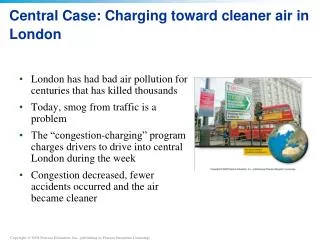
Air Quality in London • Despite significant improvements in recent years, London's air pollution is still a concern and contributes to: • 4,000 premature deaths in London in 2008 (GLA health report) • 50,000 deaths in the UK annually (UK Environmental Audit Committee in 2009) • Heavier diesel vehicles are a major source of air pollution that affects people with asthma, chest and heart conditions: it’s the poorest, the old, the very young and the sick that suffer most.
Mayoral obligation • 2001 – Feasibility Study into reducing traffic emissions • 2003 – Detailed study into implementing LEZ • 2004 – LEZ is Mayoral manifesto commitment • 2005 – Strategic Review into LEZ • 2005 – TfL asked to consult with public and stakeholders on Strategy Revisions (principle of a LEZ) • 2006 – Mayor approved Strategy Revisions, with modifications, following public consultation • 2007– Consultation on Scheme Order (details of LEZ) • May 2007 – Mayor Approves LEZ Scheme Order • - consultation on Mayors Transport Strategy, Mayors Air Quality Strategy & LEZ scheme order to defer introduction of vans and minibuses to 2012
Changes in 2012: going a step further HGVs, Buses and Coaches : A Euro III rigid truck produces 5 times the PM of a Euro IV vehicle
Changes in 2012: going a step further Larger Vans and Minibuses: targets 12% of dirtiest vehicles only A 15 year old van produces 4 times the PM pollution of a 9 yr old (Euro 3) van
LEZ Impacts Since its Introduction in 2008 LEZ has had a real impact on pollution saving 28 tonnes of particulate matter which is equal to saving 127 million km driven by a Euro III Artic that is 160 return trips to the moon or approximately 677,000 times around the M25 LEZ reduces pollution at the road site – where the pollution is heaviest and targets the kind of pollution – fine particles - which are most hazardous to health. The LEZ changes in 2012 will deliver around twice these reductions in air pollution -critical to London meeting legal air quality standards. Including vans and minibuses will give children with chest complaints over 12,000 days free from suffering symptoms and adults almost 18,000 days
Conclusions • CC & LEZ address specific London issues • TfL does not support any move to harmonisation • EU could significantly mitigate impacts of multiple zones by • Encouraging best practice re consultation • Ensure schemes recognise and cater for visitors including information in a minimum number of languages, remote payment and registration etc • Standardisation of vehicle documentation to enable age, weight, seats, CO2 and air quality emissions to be determined easily • Standardisation of retrofit documentation • Expand central information resource • Strengthen facility for cross border enforcement