Download
1 / 40
400 likes | 611 Views
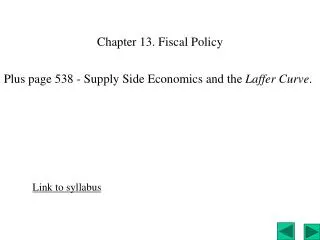
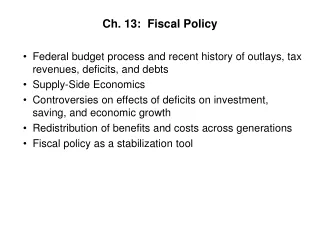
Ch. 13: Fiscal Policy. Federal budget process and recent history of outlays, tax revenues, deficits, and debts Supply-Side Economics Controversies on effects of deficits on investment, saving, and economic growth Fiscal policy as a stabilization tool. The Federal Budget and Fiscal Policy.

E N D
Ch. 13: Fiscal Policy • Federal budget process and recent history of outlays, tax revenues, deficits, and debts • Supply-Side Economics • Controversies on effects of deficits on investment, saving, and economic growth • Fiscal policy as a stabilization tool
The Federal Budget and Fiscal Policy • Federal budget • annual statement of the federal government’s outlays and tax revenues. • Two purposes • finance the activities of the federal government • achieve macroeconomic objectives • Fiscal policy • the use of the federal budget to achieve macroeconomic objectives • Employment Act of 1946 it is the continuing policy and responsibility of the Federal Government to use all practicable means . . . to coordinate and utilize all its plans, functions, and resources . . . to promote maximum employment, production, and purchasing power.
(Normal) Timeline for Budget Process February to MarchPresident submits budget request to Congress. May-August: House and Senate revise/amend proposals SeptemberHouse-Senate conference committees resolve differences and agree on final versions of spending bills. President signs or vetoes final bills. October 1Beginning of fiscal year (10/1/2013 is beginning of 2014 fiscal year). Congress passes continuing resolutions to maintain funding for any agencies affected by appropriations bills that have not been passed and signed by the beginning of the fiscal year.
Fiscal Policy • The Council of Economic Advisors • Chaired by Jason Furman • keeps the President and public informed about the current state of the economy • evaluates economic proposals • Provides data to inform the budget-making process. • Congressional Budget Office • Forecasts effects of legislative changes on budget and economy
Federal Deficits and Public Debt • Budgett = revenuet –outlayst • if Budgett > 0 budget surplus • if Budgett < 0 budget deficit • (outlays include interest on debt) • Debtt = Debtt-1 - budgett-1 • Budget deficits increase debt • Budget surpluses decrease debt
The Federal Budget Outlays
State and Local Budgets • The total government sector includes state and local governments as well as the federal government. • In 2008, when federal government outlays were about $3,200 billion, state and local outlays were a further $2,000 billion. • Most of state expenditures were on public schools, colleges, and universities ($550 billion); local police and fire services; and roads. • Most states have “balanced budget amendments”.
Supply-Side Economics • Fiscal policy aimed at increasing LAS • Income taxes affect LAS by affecting labor supply. • Higher income taxes reduce labor supply & reduce LAS • “Supply-siders” argue for low marginal tax rates. • Graph the effect of an increase in income tax rate on • before-tax real wage rate, after-tax real wage rate. • Tax-wedge (difference between before and after tax wage) • Equilibrium employment • LAS
Share of income paid in taxes Source: http://www.cbo.gov/publications/collections/tax/2010/graphics.cfm
Source: http://www.cbo.gov/publications/collections/tax/2010/graphics.cfm
Source: http://www.cbo.gov/publications/collections/tax/2010/graphics.cfm
Average Federal Tax Rate by Income Quintile, 1979-2007 (note: all federal taxes included)
The Supply-Side: The Laffer Curve. Tax Revenue Tax Rates
The Laffer Curve • As tax rates rise, taxable income may fall because • People reduce work hours • Tax avoidance increases • Legal tax avoidance • Charities • Tax free bonds • Pension saving • Capital gains versus income • Illegal tax avoidance • Under-report income • Inflate deductions
Laffer Curve and Capital Gains Tax Laffer curve and corporate income tax rate – tax havens video Source: http://time-blog.com/curious_capitalist/2008/01/do_capital_gains_tax_cuts_incr.html
The Supply-Side: Investment and Saving • GDP = C + I + G + (X – M) • GDP = C + S + T I + G + (X – M) = S + T • I = S + (T – G) + (M – X) Private saving PS = S + (M – X) Government Saving GS=T-G I = PS + GS
The Supply-Side: Investment and Saving • Fiscal policy influences investment and saving in two ways: • Taxes affect the incentive to save and change the supply of loanable funds. • Government saving is a component of total saving and the supply of loanable funds.
The Supply-Side: Investment and Saving • A tax on capital income decreases the supplyof loanable funds • a tax wedge is driven between the interest rate and the after-tax interest rate • Investment and saving decrease.
The Supply-Side: Investment and Saving • Effect of a government budget deficit on saving and investment -- crowding out
The Supply-Side: Investment and Saving • Ricardo-Barro Equivalence • In above diagram, it is assumed that government budget does not shift PSLF curve. • Ricardo-Barro: • Larger deficits cause households to increase savings in order to cover future tax increases. • Net effect of larger deficit on SLF curve is zero because PSLF curve shifts right. • No effect on investment or interest rates • All increases in deficits are offset by increased saving (decreased consumption).
Stabilizing the Business Cycle • Discretionary fiscal policy • action that is initiated by an act of Congress. • Automatic fiscal policy (Auto stabilizers) • fiscal policy triggered by the state of the economy.
Stabilizing the Business Cycle • Discretionary Fiscal Stabilization • An increase in government expenditure or a tax cut increases aggregate demand. • The “multiplier process” increases aggregate demand further. • Size of multiplier is controversial.
Stabilizing the Business Cycle • A decrease in government expenditure or a tax increase decreases aggregate demand. • The multiplier process decreases aggregate demand further.
Stabilizing the Business Cycle • Limitations of Discretionary Fiscal Policy • Recognition lag • time it takes to figure out that fiscal policy action is needed. • Law-making lag • time it takes Congress to pass the laws needed to change taxes or spending. • Impact lag • time it takes from passing a tax or spending change to its effect on real GDP being felt.
Stabilizing the Business Cycle • Automatic Stabilizers • mechanisms that stabilize real GDP without explicit action by the government. • Taxes that rise and fall with GDP taxes and needs-tested spending are automatic stabilizers. • When real GDP decreases in a recession • wages and profits fall, so taxes fall • Needs-tested spending rises • Budget deficit grows (surplus shrinks)
The Budget and the Business Cycle • Cyclical and Structural Balances • Actual Budget = Cyclical Budget + Structural Budget • The structural surplus or deficit • the surplus or deficit that would occur if the economy were at full employment and real GDP were equal to potential GDP. • The cyclical surplus or deficit • the surplus or deficit that occurs purely because real GDP does not equal potential GDP. • Cyclical budget < 0 if GDP< potential GDP
Source: http://www.cbo.gov/ftpdocs/120xx/doc12039/01-26_FY2011Outlook.pdf
Effects of economy on budget Source: http://www.cbo.gov/ftpdocs/120xx/doc12039/01-26_FY2011Outlook.pdf
Effects of economy on budget Source: http://www.cbo.gov/ftpdocs/120xx/doc12039/01-26_FY2011Outlook.pdf