Download
1 / 28
280 likes | 284 Views
This article explains the concept of autocorrelation in time series data and spatial autocorrelation in spatial data. It discusses how to reduce autocorrelation and provides practical solutions for analyzing relationships between autocorrelated values.

E N D
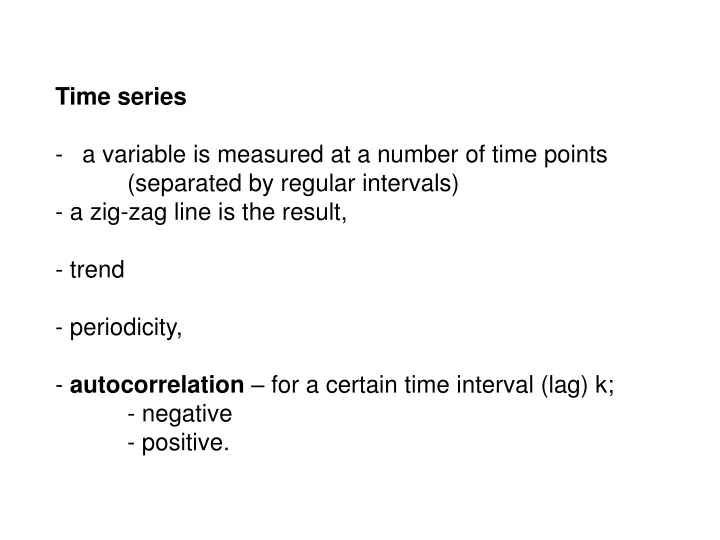
Time series • a variable is measured at a number of time points (separated by regular intervals) - a zig-zag line is the result, - trend - periodicity, - autocorrelation – for a certain time interval (lag) k; - negative - positive.
- random numbers - voles in Lapland - sea water salinity - abundance of algae
random numbers voles in Lapland autocorrelation (years) abundance of some algae sea water salinity (years)
Theory is oriented towards forecasting, but other things can be done, when looking for relationships, ordinary regression should not be applied, data points are not independent, a danger of pseudoreplication!
stock aktsiad stock price flies põdrakärbsed fly abundance r= 0.96, p<0.0001 sample population
What can we do if we want to study a relationship between two autocorrelated values, e.g. between hares and foxes? - reduce autocorrelation! - differences instead of raw values! • use more complex models, which explictly • account for autocorrelation
Correlo- gram, hares have an autocorr, foxes do not have time lag k
Ordinary linear regression was performed, p=0.006 there is still autocorrelation in the residuals
A model including autocorrelation, there is no autocorrealtion in the residuals, p = 0.0139
There is another practical problem, we need more than 50 observations, to be able to apply methods of time series analysis. .... but an analogous situation can also appear in space.
Values close to each other in space are similar, autocorrelation in space, or spatial autocorrelation, SAC
In principle, autocorrelation in space can be expressed in the same way as autocorrelation in time, on x-axis is the value ‘here’ and on the y-axis is the value k units apart; but there may be nobody exactly k units apart, that’s why a slightly different approach, Moran’s I, here the k is a threashold value: points which are ‘close’, compared to points which are ‘far’, are they more similar? The resulting values can be interpreted as autocorrelations . Correlogram shows the dependence of I on the lag k.
Correlogram: the dependence of Moran’s I on the threshold value k,
Analysis in the case of SAC, SAC can be present both in dependent and independent variables, autocorrelation causes pseudoreplication,
stock aktsiad stock price flies põdrakärbsed fly abundance r= 0.96, p<0.0001 sample population
plastic bags plastic bags crabs crab r= 0.97, p<0.0001 sample population
Analysis in the case of SAC, SAC can be present both in dependent and independent variables, autocorrelation causes pseudoreplication, but the probleem is smaller than in time series, because the values are formed in situ and are not causally related to neighbouring values, SAC results from independent variables; example: growth rate dependent on 1) temperature, 2) plant quality, SAC can be removed by choosing independent variables.
The model is OK when there is no SAC in residuals, we can see this in the image and correlogram; If this is not the case: - modify the set of independent variables; - change the spatial scale; if it does not help, use: spatialregessionmethods. • SAC is removed from the variables by appropriate trans- formations; 2) SAC is explicitly accounted for in the models. …. the model is OK if there is no SAC in the residuals.
residuals ordinary regressioon: SAC is present
residuals spatial regression: SAC has disappeared