Download
1 / 16
160 likes | 303 Views
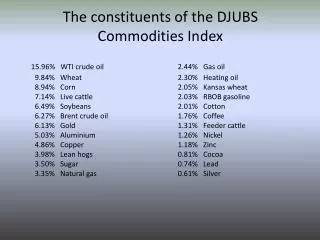
The Power of the Index. The Compelling Business Reason Why did we have to work on ES?. >32% Turnover in 2007 and 23% in 2008 40% tenure of <1 year Turnover is averagely estimated at € 30,000- a head So when 1/3 of 1000 employees leave a year costs are approaching € 10 Mio !

E N D
The Compelling Business ReasonWhy did we have to work on ES? • >32% Turnover in 2007 and 23% in 2008 • 40% tenure of <1 year • Turnover is averagely estimated at € 30,000- a head • So when 1/3 of 1000 employees leave a year costs are approaching € 10 Mio ! • An attainable 30% improvement yields > € 3 Mio cost savings.
Reasons for High Turnover • Analysis (exit interviews and retention workshops) showed Three reasons why people left the company only 2 years ago • Number 1: LACK OF ATTENTION BY MY MANAGER • Number 2 & 3 respectively: Perspective & Salary • Number 2 & 3 are issues that many companies deal with • Salary is easy to copy • In terms of importance the survey group weighted the number 1 reason with 60% and 2&3 respectively with 20% and 20%.
Quick Question: • Can you have high employee satisfaction and a high employee turnover at the same time? • Can you have high employee satisfaction and very few ambassadors in your company? • Can you have a low score on leadership and low employee turnover? • Do we agree that high employee turnover and very few ambassadors in your company hurt the business?
What is remarkable about these numbers? • 5.3 • >32% • -18
Recap of our results • Initially the Employee Satisfaction was expressed in a number on a scale of 7 > 5.3 for 2008 • Last survey yielded a so called ESI > 79% • -18 = Nett Promotor Score 2008 • LSI of 56 in 2008 (as of 63 it starts turning green)
A Closer Look at the Indexes • Leadership Index (LSI) is designed to put a numerical value on the leadership in a work group. The LSI value lies between 0 and 100. The weighted average value of the answers from the employee survey creates the index. The highest level is attainable only through a high number of ‘Unconditional Yes Excellent’ scores. • Nett Promotor Score (NPS) Obtained by 1 (one) question only: • Would you recommend Tele2 as an employer with your family & friends? • Employee Satisfaction Index (ESI) • 11 Questions of which the Index is found to be linked with profitability if one scores on or above the benchmark (>4.5+)
Development path 1 Communicate goals & Performance Development path 1 Communicate goals & Performance Development path 2 Coaching & Feedback Development path 2 Coaching & Feedback Development path 5 Team Communication Development path 3 Handling Conflicts Development path 4 Building Trust LSI Questions & Development Paths • Has your immediate manager clearly communicated the goals for your work group? • Do you regularly get to know how you are doing in your work? • Do you think your performance review talks are productive? • Do you think your immediate manager can handle conflicts? • Does your immediate manager show you respect? • Do you get sufficient information from your immediate manager? • Do you think your work group is managed in a satisfactory way?
Low Performance on LeaderShipIndex (LSI) & Nett Promotor Score (NPS) • In addition to high employee turnover and its indicators • Low Performance on LSI: • Overall 56 (/100) • 50% of managers (70) <green treshold score of 63 • NPS of -18 • Overall a lot of ‘yellow’
LSI is ‘King’We decided to embark on a mission • (1) Increasing overall LSI • (2) Increasing individual LSI • (3) Positive NPS
The Measures Taken • All managers to go through Situational Leadership Training • All managers to organize ESS workshops • All managers to have an individual LSI target (part of bonus: 20%) • An intensive Corporate Communications campaign on ‘Ambassadors’ • In interim Barometer survey yielding interim LSI / NPS scores • CEO organizing ‘All Mgrs’ meeting with LSI themes • New Initiative: Tele2 Learning Center launching ‘LSI development paths’
What is remarkable about these numbers? • <13% • +18 • 69
Question • What do you think ‘leavers’ indicate now as the number one reason for their exit?
Question • What do you think ‘leavers’ indicate now as the number one reason for their exit? “Perspective”
Recap of our Goals for 2010 • ESI to 100% • LSI to >69 • All Managers to improve on individual LSI > 20% of bonus • Employee Turnover < 13% • Positive NPS >benchmark