Download
1 / 1
10 likes | 115 Views
Identifying, Visualising and Comparing Regions in 3D Surface Data. Matthew J Thurley Associate Professor Kim C. Ng Dr Kemal Ajay. Introduction

E N D
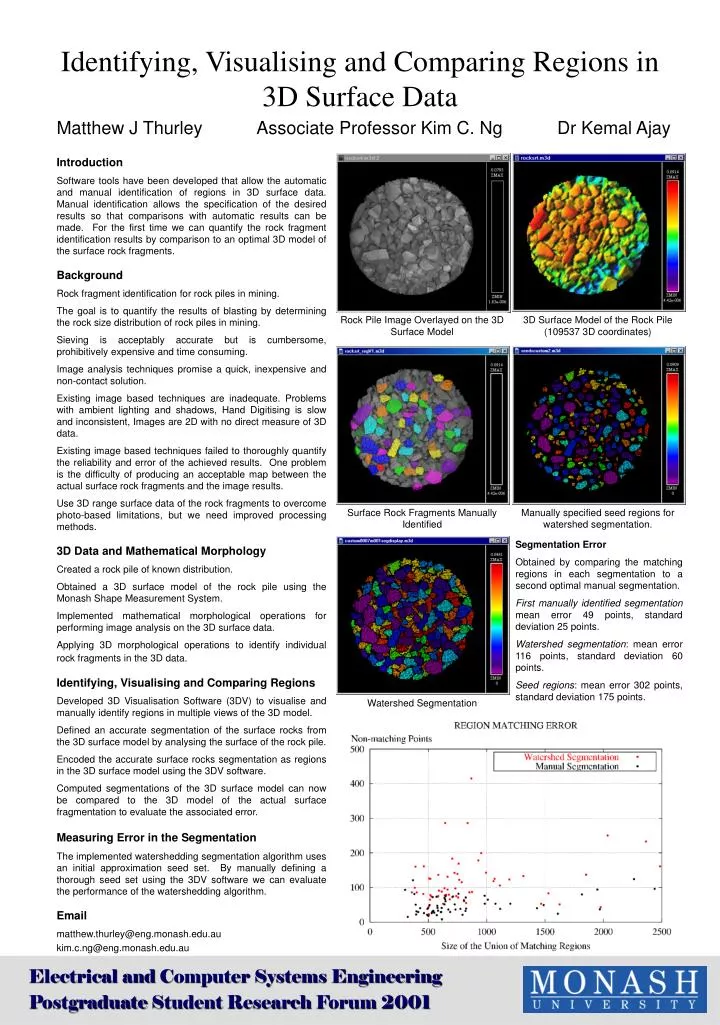
Identifying, Visualising and Comparing Regions in 3D Surface Data Matthew J Thurley Associate Professor Kim C. Ng Dr Kemal Ajay Introduction Software tools have been developed that allow the automatic and manual identification of regions in 3D surface data. Manual identification allows the specification of the desired results so that comparisons with automatic results can be made. For the first time we can quantify the rock fragment identification results by comparison to an optimal 3D model of the surface rock fragments. Background Rock fragment identification for rock piles in mining. The goal is to quantify the results of blasting by determining the rock size distribution of rock piles in mining. Sieving is acceptably accurate but is cumbersome, prohibitively expensive and time consuming. Image analysis techniques promise a quick, inexpensive and non-contact solution. Existing image based techniques are inadequate. Problems with ambient lighting and shadows, Hand Digitising is slow and inconsistent, Images are 2D with no direct measure of 3D data. Existing image based techniques failed to thoroughly quantify the reliability and error of the achieved results. One problem is the difficulty of producing an acceptable map between the actual surface rock fragments and the image results. Use 3D range surface data of the rock fragments to overcome photo-based limitations, but we need improved processing methods. 3D Data and Mathematical Morphology Created a rock pile of known distribution. Obtained a 3D surface model of the rock pile using the Monash Shape Measurement System. Implemented mathematical morphological operations for performing image analysis on the 3D surface data. Applying 3D morphological operations to identify individual rock fragments in the 3D data. Identifying, Visualising and Comparing Regions Developed 3D Visualisation Software (3DV) to visualise and manually identify regions in multiple views of the 3D model. Defined an accurate segmentation of the surface rocks from the 3D surface model by analysing the surface of the rock pile. Encoded the accurate surface rocks segmentation as regions in the 3D surface model using the 3DV software. Computed segmentations of the 3D surface model can now be compared to the 3D model of the actual surface fragmentation to evaluate the associated error. Measuring Error in the Segmentation The implemented watershedding segmentation algorithm uses an initial approximation seed set. By manually defining a thorough seed set using the 3DV software we can evaluate the performance of the watershedding algorithm. Email matthew.thurley@eng.monash.edu.au kim.c.ng@eng.monash.edu.au Rock Pile Image Overlayed on the 3D Surface Model 3D Surface Model of the Rock Pile (109537 3D coordinates) Surface Rock Fragments Manually Identified Manually specified seed regions for watershed segmentation. Segmentation Error Obtained by comparing the matching regions in each segmentation to a second optimal manual segmentation. First manually identified segmentation mean error 49 points, standard deviation 25 points. Watershed segmentation: mean error 116 points, standard deviation 60 points. Seed regions: mean error 302 points, standard deviation 175 points. Watershed Segmentation Electrical and Computer Systems Engineering Postgraduate Student Research Forum 2001