Download
1 / 69
700 likes | 841 Views
Introduction to Geographic Information Systems and Remote Sensing for Water Quality and other environmental analyses. AP Environmental Science Mr . Johnston, Fall 2012 Bob Jones High School, Madison, AL. Eric R. Anderson M.S. Candidate, Earth System Science

E N D
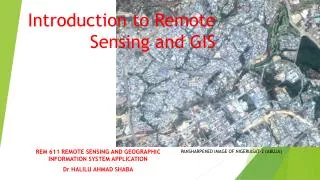
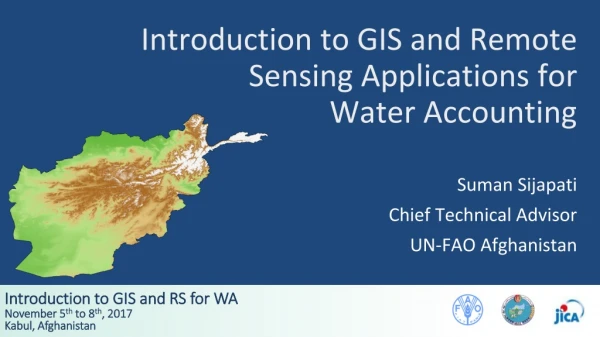
Introduction to Geographic Information Systems and Remote Sensing for Water Quality and other environmental analyses AP Environmental Science Mr. Johnston, Fall 2012 Bob Jones High School, Madison, AL Eric R. Anderson M.S. Candidate, Earth System Science Department of Atmospheric Science University of Alabama in Huntsville
Introductions • Who am I? • Who are you?
My goals • Introduce you to GIS, GPS and remote sensing • Enable you to explore how these tools can help you understand environmental science • Focus on water resources, water pollution, and related topics, while also recognizing the interdisciplinarityof geography and environment • Stimulate critical thinking on environmental data, analysis methods and social-ecological systems • Help prepare you to get a 5 on your AP test!
How these modules are organized • These GIS modules fit into the water and water pollution topics of your APES class • Introduction to GIS & remote sensing (10 Oct) • Lab 1 – Hands-on intro to GIS tools (11 Oct) • GPS Day – mapping riparian zones around BJHS campus (12 Oct) • Lab 2 – Bringing your data into GIS (17 Oct) • Lab 3 – Remote sensing (18 Oct)
Today • GIS as a tool • Key water concepts • Water resources/pollution issues at home and abroad • The many applications of GIS and remote sensing
Ancient humans and their environment Delta Old Kingdom Egypt First Intermediate Period Stelae Inscriptions (2160-2055 BC) Fayum Prophecy of Neferti: “Dry is the river of Egypt, one crossed the water on foot; one seeks water for ships to sail on, its course having turned into shore land.” Ankhtifiof Mo’alla: “All of Upper Egypt was dying of hunger and each individual had reached such a state of hunger that he ate his own children.” Nile River
Ancient humans and their environment Desertification Decline in Northern Africa During Roman times served as “granary of the Empire” Yielded huge wheat harvests More wheat came into Rome from Egypt and northern Africa than from the Italian peninsula.
Ancient humans and their environment • Maya civilization as illustrated in the 1830-40s
Ancient humans and their environment • Lime plaster production for Maya architecture el mirador, guatemala 20 felled trees produce only 1 m³ of lime plaster …imagine for an entire city
Ancient humans and their environment • Common thread: ground-level view of their environments
Some very brief history • Camera mounted on V-2 missile launched from White Sands, New Mexico, 1946
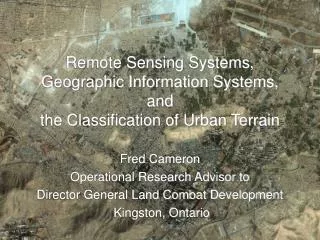
Some very brief history • Canada Geographic Information System (CGIS) • 1960s-1970s, Department of Forestry and Rural Development • Land use management and resource monitoring
Some very brief history • M&S Computing (now Intergraph) • Corporate HQ in Huntsville, AL • Pioneer in computer graphics for engineering applications • ERDAS IMAGINE
What is GIS? • Geographic Information Systems address: • Where are features found? • What geographical patterns exist? • Where have changes occurred over time? • Where do certain conditions apply? • What happens where if I take a certain action? • GIS is: • Hardware • Software • Data • People
What is GIS? • GIS enables: • Collecting, managing, analyzing, and displaying data from the real world • Understanding, interpretation, visualization of data • GIS includes: • Global Positioning Systems (GPS) • Remote Sensing (RS)
Data, information, knowledge… • Data: representation or symbol of something real • Information: data processed to the point of being useful. Answers: Who? What? Where? When? • Knowledge: application of data and information. Answers: How? • Understanding: analytical, ability to synthesize new knowledge; appreciation of Why? • Wisdom:calls various levels of understanding; asks what cannot be answered; process of discerning or judging between right and wrong
Wisdom Connectedness Understandingprinciples Knowledge Understandingpatterns Information Understandingrelations Data Understanding Data, information, knowledge…
Spatial data types Vector Raster Points, lines, polygons (a.k.a. features) Many values or attributes per feature Discrete Grid cells or “pixels” One value per cell Discrete or continuous The neat/confusing thing is that pretty much anything on Earth (or elsewhere!) can be stored/represented as the data type you decide is most appropriate
Spatial data types – vectors • Give me some examples of things you’d like to map or study that could be stored / analyzed as a point, line or polygon • Would it be useful to store certain features as points in one case and polygons in another? • Lines polygons? • Why does this matter?
Spatial data types – rasters • What is continuous data? (vs. discrete)
Spatial data types – rasters • Satellite images – water vapor (GOES / NOAA)
Spatial data types – rasters • Satellite data – ASTER (NASA/JAXA)
Spatial data types – rasters • Satellite data – Bing (WorldView satellite?)
Spatial data types – rasters • What are other kinds of continuous data?
What is a watershed? Drainage network Watershed boundary Watershed
Watershed – it’s not just hydrology • System composed of the interrelationships among social, economic, demographic and biophysical subsystems • Unit of measure for planning and evaluation • Their management includes natural and human-induced disaster prevention ¹ Trejos, Noel 2008. Presentation, “Retos y perspectivas del manejointegrado de cuencashidrográficaspara la mitigación de impactos del cambioclimático”
Watersheds serve as boundaries Watershed boundary Drainage network • Geophysical and political limits • Watershed boundaries • Rivers (these change frequently!) Watershed
Río Sixaola – floods change international borders Costa Rica ASTER Panama SPOT Analysis in the context of the Regional Visualization and Monitoring System (SERVIR) www.servir.net
Unconfined Aquifer Recharge Area Evaporation and transpiration Evaporation Precipitation Confined Recharge Area Runoff Flowing artesian well Recharge Unconfined Aquifer Stream Well requiring a pump Water table Infiltration Lake Infiltration Unconfined aquifer Less permeable material such as clay Confined aquifer Confining impermeable rock layer Fig. 14-3, p. 308
Mapping Alabama Groundwater Levels Lee Ellenburg PhD candidate, Environmental Engineering UAHuntsville Earth System Science Center
GIS Data Manipulation • Took only data from 1982 to present • Dissolved individual wells • 350 wells – 13290 Observations • Averaged yearly and seasonal depths
Aquifer Determination • Determined pressure head from drilled depth and water depth • Interpolated differences into raster by the Inverse Distance Weighted Algorithm
Used Kriging • Spatial statistical model that includes autocorrelation • Provides some measure of the certainty or accuracy of the predictions
Estimating Agricultural Water Use • Normalized Difference Vegetation Index • Evaporation
Groundwater Pumping in Saudi Arabia (NASA Landsat images,1987 – 2012) • Irrigation systems from the nonrenewable aquifer appear as green dots. Brown dots are dry or fallow fields, possibly indicating locations of wells that have gone dry. acquired February 5, 1987
Groundwater Pumping in Saudi Arabia (NASA Landsat images,1987 – 2012) • Irrigation systems from the nonrenewable aquifer appear as green dots. Brown dots are dry or fallow fields, possibly indicating locations of wells that have gone dry. acquired February 24, 1991
Groundwater Pumping in Saudi Arabia (NASA Landsat images,1987 – 2012) • Irrigation systems from the nonrenewable aquifer appear as green dots. Brown dots are dry or fallow fields, possibly indicating locations of wells that have gone dry. acquired March 12, 2000
Groundwater Pumping in Saudi Arabia (NASA Landsat images,1987 – 2012) • Irrigation systems from the nonrenewable aquifer appear as green dots. Brown dots are dry or fallow fields, possibly indicating locations of wells that have gone dry. acquired January 17, 2012
Trade-Offs Withdrawing Groundwater Advantages Disadvantages Useful for drinking and irrigation Aquifer depletion from overpumping Sinking of land (subsidence) from overpumping Available year-round Exists almost everywhere Polluted aquifers for decades or centuries Renewable if not overpumped or contaminated Saltwater intrusion into drinking water supplies near coastal areas Reduced water flows into surface waters No evaporation losses Increased cost and contamination from deeper wells Cheaper to extract than most surface waters Fig. 14-7, p. 313
Water Pollution Problems in Streams Normal clean water organisms (Trout, perch, bass, mayfly, stonefly) Trash fish (carp, gar, leeches) Fish absent, fungi, sludge worms, bacteria (anaerobic) Trash fish (carp, gar, leeches) Clean Normal clean water organisms (Trout, perch, bass, mayfly, stonefly) Types of organisms 8 ppm Dissolved oxygen (ppm) 8 ppm Clean Zone Biological oxygen demand Recovery Zone Septic Zone Decomposition Zone Clean Zone • Dilution and decay of degradable, oxygen-demanding wastes and heat in a stream. Fig. 21-4, p. 497
Cultural Eutrophication • Eutrophication: the natural nutrient enrichment of a shallow lake, estuary or slow moving stream, mostly from runoff of plant nutrients from the surrounding land. • Cultural eutrophication: human activities accelerate the input of plant nutrients (mostly nitrate- and phosphate-containing effluents) to a lake. • 85% of large lakes near major population centers in the U.S. have some degree of cultural eutrophication.
Remote sensing identification of Cyanobacterial blooms Africa Flores SERVIR GRA / MS candidate Earth System Science UAHuntsville Dept. of Atmospheric Science
This presentation focuses on the advantages that remote sensing represents to map Cyanobacterial blooms Cyanobacterial Blooms Conventional methods Use of remote sensing