Download
1 / 25
250 likes | 510 Views
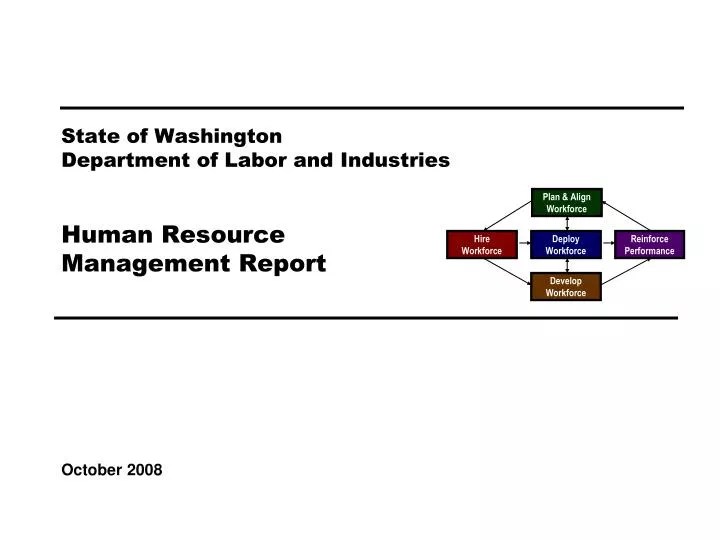
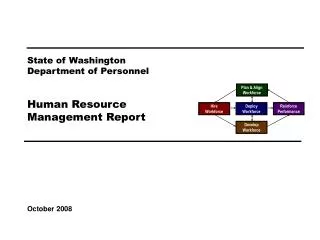
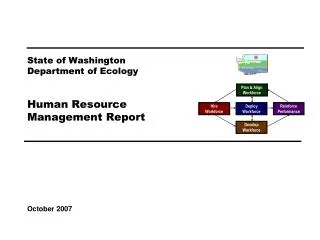
Plan & Align Workforce. Hire Workforce. Deploy Workforce. Reinforce Performance. Develop Workforce. State of Washington Department of Labor and Industries Human Resource Management Report. October 2008. Plan & Align Workforce. Outputs. Initial Outcomes. Intermediate Outcomes.

E N D
Plan & Align Workforce Hire Workforce Deploy Workforce Reinforce Performance Develop Workforce State of WashingtonDepartment of Labor and IndustriesHuman ResourceManagement Report October 2008
Department of Labor and Industries Plan & Align Workforce Outputs Initial Outcomes Intermediate Outcomes Articulation of managers HRM accountabilities. HR policies. Workforce planning. Job classes & salaries assigned. Managers understand HRM accountabilities. Jobs, staffing levels, & competencies aligned with agency priorities. Foundation is in place to build and sustain a productive, high performing workforce. HireWorkforce Qualified candidate pools, interviews & reference checks. Job offers. Appts & per-formance monitoring. Best candidate hired & reviewed during appointment period. Successful performers retained. The right people are in the right job at the right time. Ultimate Outcomes Employees are committed to the work they do & the goals of the organization Productive, successful employees are retained State has workforce depth & breadth needed for present and future success DeployWorkforce Work assignments& requirements defined. Positive workplace environment created. Coaching, feedback, corrections. Workplace is safe, gives capacity to perform, & fosters productive relations. Staff know job rqmts, how they’re doing, & are supported. Time & talent is used effectively. Employees are motivated & productive. Develop Workforce Individual development plans. Time/ resources for training. Continuous learning environment created. Learning environment created. Employees are engaged in develop-ment opportunities & seek to learn. Employees have competencies for present job & career advancement Agencies are better enabled to successfully carry out their mission. The citizens receive efficient government services. Reinforce Performance Clear performance expectations linked to orgn’al goals & measures. Regular performance appraisals. Recognition. Discipline. Employees know how performance contributes to success of orgn. Strong performance rewarded; poor performance eliminated Successful perf is differentiated & strengthened. Employees are held accountable. Managers’ Logic Model for Workforce Management
Percent supervisors with current performance expectations for workforce management Management profile Workforce planning measure (TBD) Percent employees with current position/competencies descriptions Time-to-fill funded vacancies Candidate quality Hiring Balance (Proportion of appointment types) Separation during review period Percent employees with current performance expectations Employee survey ratings on “productive workplace” questions Overtime usage Sick leave usage Non-disciplinary grievances/appeals filed and disposition (outcomes) Worker safety Percent employees with current individual development plans Employee survey ratings on “learning & development” questions Competency gap analysis (TBD) Percent employees with current performance evaluations Employee survey ratings on “performance & accountability” questions Disciplinary actions and reasons, disciplinary grievances/appeals filed and disposition (outcomes) Reward and recognition practices (TBD) Department of Labor and Industries Plan & Align Workforce HireWorkforce DeployWorkforce Develop Workforce Reinforce Performance Standard Performance Measures Ultimate Outcomes • Employee survey ratings on “commitment” questions • Turnover rates and types • Turnover rate: key occupational categories • Workforce diversity profile • Retention measure (TBD)
Department of Labor and Industries Plan & Align Workforce Hire Workforce Deploy Workforce Develop Workforce Reinforce Performance Ultimate Outcomes Labor and Industries embraces the elements of this HR management report. Our strategic plan includes a number of objectives aimed at increasing measures of accountability, strategic alignment, performance-based decisions, more effective performance reviews and hiring practices based on achievement, not perception. • L&I has adopted core competencies for all positions. • We are integrating that data into HR processes for recruitment, classification, and performance appraisal. • Average time to fill a vacant position is dependent upon many things, however our average time is 29.8 days over the period July 1, 2007 to June 30, 2008. • L&I has identified critical job classes for recruitment priority. We continue to analyze turnover in critical classes for patterns and solutions. • We train supervisors to assess candidates based on past successful performance. • Average sick leave used by L&I staff varies little from the statewide average., however among the segregated sick leave users, L&I averages less than the statewide average. • Wellness is a priority at L&I. • Workforce resources are studied regularly and re-distributed as needed, with less regard for divisional boundaries. • L&I has conducted its fourth Supervisory Conference. The Leadership Capstone program is in its second session. We are developing guidelines for succession plans for critical program tasks. • “Diversity Fundamentals” and “Sexual Harassment Prevention” training are due for deployment in Fall 2008. • Our Training and Development staff use competency-based curriculum development. • L&I implemented a performance appraisal process based on core competencies and strategic expectations, tied to agency goals. The process requires individual development plans for each employee. • We track expectations, evaluations and development plans separately. • We are studying turnover and survey results to make L&I a “destination workplace.” • We are monitoring turnover in critical classes, and fashioning succession and career plans to cure. • Diversity is among our core competencies. In order to
Plan & Align Workforce Outcomes: Managers understand workforce management accountabilities. Jobs and competencies are defined and aligned with business priorities. Overall foundation is in place to build & sustain a high performing workforce. Performance Measures: Percent supervisors with current performance expectations for workforce management Management profile Workforce Planning measure (TBD) Percent employees with current position/ competency descriptions Department of Labor and Industries Workforce Management Expectations Agency Priority: High • Analysis: • L&I is developing a performance-based culture. Core management competencies include workforce management. • Recognizing the strategic importance of workforce management, L&I includes high-performance accountability in it’s strategic plan. • Action Steps: • Continue to hold managers and supervisors accountable for successful workforce planning. • Expand the use of core competencies. • Refine and expand ability to access and use workforce data. Percent supervisors with current performance expectations for workforce management = 100%* *Based on 313 of 313 reported number of supervisors • From Goal 6, 2007 – 2011 Strategic Plan • Plan and align the workforce to achieve state, agency and program objectives. • When fully implemented, every employee will have a job description that aligns their work with state, agency and program objectives. Supervisors will engage in and are successful with workforce management. Data as of 06/08 Source: L&I
Plan & Align Workforce Outcomes: Managers understand workforce management accountabilities. Jobs and competencies are defined and aligned with business priorities. Overall foundation is in place to build & sustain a high performing workforce. Performance Measures: Percent supervisors with current performance expectations for workforce management Management profile Workforce Planning measure (TBD) Percent employees with current position/ competency descriptions Department of Labor and Industries Management Profile Agency Priority: Low WMS Employees Headcount = 143 Percent of agency workforce that is WMS = 5.2 % Managers* Headcount = 156 Percent of agency workforce that is Managers* = 5.7 % * In positions coded as “Manager” (includes EMS, WMS, and GS) • Analysis: • L&I’s historical WMS percentage is 5.1%. • L&I’s assigned WMS cap is 4.9%, a 2-year low. • Action Steps: • Continue to monitor. Data Time Period: 07/07 through 06/08 WMS Management Type Management 122 Consultant 16 Policy 3 Not Assigned 2 Data as of 06/08 Source: DOP HRMS
Plan & Align Workforce Outcomes: Managers understand workforce management accountabilities. Jobs and competencies are defined and aligned with business priorities. Overall foundation is in place to build & sustain a high performing workforce. Performance Measures: Percent supervisors with current performance expectations for workforce management Management profile Workforce Planning measure (TBD) Percent employees with current position/ competency descriptions Department of Labor and Industries Current Position/Competency Descriptions • Analysis: • A requirement of supervisors’ workforce management competency is annual review and update of subordinates’ job descriptions. • To the extent we can track updated position descriptions manually, we believe this report to be accurate. • Action Steps: • Devise and implement an effective method of tracking updated position descriptions and assertions of currency. • Apply competency requirements to recruitment and selection strategies. • Continue to monitor. Agency Priority: High Percent employees with current position/competency descriptions = 87%* *Based on 2130 of 2436 reported employee count Applies to employees in permanent positions, both WMS & GS From Goal 6, 2007 – 2011 Strategic Plan 2. Attract and retain new hires with needed skills. We will continue an aggressive recruitment effort to attract qualified candidates. This effort includes extensive outreach with professional organizations and higher education institutions, making sure they know the range of skills we need and the opportunities we offer. In addition, our recruitment materials and presentations emphasize the benefits of working in this agency. Data as of 06/08 Source: L&I
Hire Workforce Outcomes: Best candidates are hired and reviewed during appointment period. The right people are in the right job at the right time. Performance Measures Time-to-fill vacancies Candidate quality Hiring Balance (proportion of appointment types) Separation during review period Department of Labor and Industries Time-to-fill / Candidate Quality Agency Priority: Medium Time-to-fill Funded Vacancies Average number of days to fill*:29.8 Number of vacancies filled: 584 *Equals # of days from creation of the requisition to job offer acceptance • Analysis: • From Goal 6, 2007 – 2011 Strategic Plan • 2. Attract and retain new hires with needed skills. We will continue an aggressive recruitment effort to attract qualified applicants. This effort includes extensive outreach with professional organizations and higher education institutions, making sure they know the range of skills we need and the opportunities we offer. In addition, our recruitment materials and presentations emphasize the benefits of working in this agency. • L&I actively manages its recruitment process. Active management includes monitoring the time hiring managers take to apply their selection strategies. Reminders and follow-up calls are made where needed. • Action Steps: • Continually review and improve strategies to attract qualified applicants to our vacancies. • Recruitment bulletins define vacancies in terms of required skills and abilities. • Continue to monitor. Agency Priority: Medium • Candidate Quality • Of the candidates interviewed for vacancies, how many had the competencies (knowledge, skills & abilities) needed to perform the job? • Number = 3416 Percentage = 89% • Of the candidates interviewed, were hiring managers able to hire the best candidate for the job? * • * L&I does not gather or track this information, yet. • Hiring managers indicating “yes”: • Number = N/A Percentage = N/A% • Hiring managers indicating “no”: • Number = N/A Percentage = N/A% Data Time Period: 07/07 through 06/08 Source: L&I
Hire Workforce Outcomes: Best candidates are hired and reviewed during appointment period. The right people are in the right job at the right time. Performance Measures Time-to-fill vacancies Candidate quality Hiring Balance (proportion of appointment types) Separation during review period Department of Labor and Industries Hiring Balance / Separations During Review Period Agency Priority: Low • Analysis: • The majority of hires at L&I are of internal candidates. This provides opportunity for staff to grow and develop, however it create an internal “churn” that can overwhelm staff capacity to replace and train. • For this report, “New Hires” result in probationary service; “Promotions” result in Trial Service. • 20 of 214 new hires, or 9.3%, failed. 4.7% left voluntarily; 4.7% left involuntarily. • 2.9% of Trial Service appointments were voluntarily ended. • No conclusions are drawn. Action Steps: • Continue to monitor. Total number of appointments = 562* 214 New Hires, 241 Promotions, 74 Transfers, 3 Exempts, 30 Others = 562 Includes appointments to permanent vacant positions only; excludes reassignments “Other” = Demotions, re-employment, reversion & RIF appointments Agency Priority: Low • Separation During Review Period • Probationary separations - Voluntary 10 • Probationary separations - Involuntary 10 • Total Probationary Separations 20 • Trial Service separations - Voluntary 7 • Trial Service separations - Involuntary 0 • Total Trial Service Separations 7 • Total Separations During Review Period 27 Data Time Period: 07/07 through 06/08 Source: DOP HRMS
Deploy Workforce Outcomes: Staff know job expectations, how they’re doing, & are supported. Workplace is safe, gives capacity to perform, & fosters productive relations. Employee time and talent is used effectively. Employees are motivated. Performance Measures Percent employees with current performance expectations Employee survey ratings on “productive workplace” questions Overtime usage Sick leave usage Non-disciplinary grievances/appeals filed and disposition (outcomes) Worker safety Department of Labor and Industries Current Performance Expectations Agency Priority: High • Analysis: • The percent of employees with current performance expectations is a disingenuous number. As calculated for this report, the number necessarily reduces as the workforce turns over, or employees move from division to division. • What was in excess of 95% in October 2007 has reduced to 87% in June 2008. • Action Steps: • Devise and implement an effective method for tracking and reporting data related to performance, including completed evaluations, evaluations due, updated expectations, updated development plans. Percent employees with current performance expectations = 87%* *Based on 2130 of 2436 reported employee count Applies to employees in permanent positions, both WMS & GS From Goal 6, 2007 – 2011 Strategic Plan 3. Promote a work environment that optimizes the use of talent, provides fair and equal opportunity to all and encourages employees to excel. We seek a diverse workforce that reflects the communities we serve. We employ tools, training and incentives, such as tuition reimbursement, to develop our existing talent and adapt employee skills and capabilities to meet future service requirements. When fully implemented, every employee will have an individual development plan that is current, relates to program and agency objectives, and contains clearly defined success factors. Data as of 06/08 Source: L&I
Deploy Workforce Outcomes: Staff know job expectations, how they’re doing, & are supported. Workplace is safe, gives capacity to perform, & fosters productive relations. Employee time and talent is used effectively. Employees are motivated. Performance Measures Percent employees with current performance expectations Employee survey ratings on “productive workplace” questions Overtime usage Sick leave usage Non-disciplinary grievances/appeals filed and disposition (outcomes) Worker safety Department of Labor and Industries Employee Survey “Productive Workplace” Ratings Agency Priority: Medium • Analysis: • Responses to Questions 1 and 9 are of particular interest to L&I. Action Steps: • Feedback and regular coaching are tools supervisors are urged to use with employees regularly. • The performance management system and follow up survey responses will demonstrate the effectiveness of those tools. Data as of 12/07 Source: L&I Agency Employee Survey
Deploy Workforce Outcomes: Staff know job expectations, how they’re doing, & are supported. Workplace is safe, gives capacity to perform, & fosters productive relations. Employee time and talent is used effectively. Employees are motivated. Performance Measures Percent employees with current performance expectations Employee survey ratings on “productive workplace” questions Overtime usage Sick leave usage Non-disciplinary grievances/appeals filed and disposition (outcomes) Worker safety Department of Labor and Industries Overtime Usage Agency Priority: Low Overall agency avg overtime usage – per capita, per month: .30** *Statewide overtime values do not include DNR **Overall agency avg overtime usage – per capita, per month = sum of monthly OT averages / # months • Analysis: • L&I’s overtime expense is significantly below the statewide average. • The number of employees receiving overtime payments is also significantly below the statewide average. Action Steps: • Continue to monitor. • L&I is developing policy and procedure for positive time reporting for overtime-eligible employees. Overall agency avg employees receiving overtime per month: 3.65%** *Statewide overtime values do not include DNR **Overall agency avg employees receiving overtime per month = sum of monthly OT percentages / # months Data Time Period: 07/07 through 06/08 Source: DOP HRMS
Deploy Workforce Outcomes: Staff know job expectations, how they’re doing, & are supported. Workplace is safe, gives capacity to perform, & fosters productive relations. Employee time and talent is used effectively. Employees are motivated. Performance Measures Percent employees with current performance expectations Employee survey ratings on “productive workplace” questions Overtime usage Sick leave usage Non-disciplinary grievances/appeals filed and disposition (outcomes) Worker safety Department of Labor and Industries Sick Leave Usage Agency Priority: Medium • Analysis: • Per capita, average sick leave use at L&I is virtually indistinguishable from the statewide average. • Among the population of sick leave users, L&I employees used 14% less sick leave than the average employee, statewide. • L&I continues to refine the separation of leave without pay and sick leave types to promote efficient use of paid leave and reduce approve use of unpaid leave. • Action Steps: • L&I has standardized data entry for leave types. • L&I has refined the data mining queries to better reflect paid and unpaid leave from unapproved leave. • Monitor regularly. Sick Leave Hrs Used / Earned (per capita) Sick Leave Hrs Used / Earned (those who took SL) * Statewide data does not include DOL, DOR, L&I, and LCB Data Time Period: 07/07 through 06/08 Source: L&I HRCafe
Deploy Workforce Outcomes: Staff know job expectations, how they’re doing, & are supported. Workplace is safe, gives capacity to perform, & fosters productive relations. Employee time and talent is used effectively. Employees are motivated. Performance Measures Percent employees with current performance expectations Employee survey ratings on “productive workplace” questions Overtime usage Sick leave usage Non-disciplinary grievances/appeals filed and disposition (outcomes) Worker safety Department of Labor and Industries Non-Disciplinary Grievances (represented employees) Agency Priority: Low Top 5 Non-Disciplinary Grievance Types (i.e., Compensation, Overtime, Leave, etc) Total Non-Disciplinary Grievances = 23 • Analysis: • L&I accounted for 3% of the state’s non-disciplinary grievances. • No specific issue dominated the 23 grievances. Action Steps: • Continue to monitor and compare to statewide grievance issues. * There may not be a one-to-one correlation between the number of grievances filed (shown top of page) and the outcomes determined during this time period. The time lag between filing date and when a decision is rendered can cross the time periods indicated. • Non-Disciplinary Grievance Disposition*(Outcomes determined during time period listed below) • Withdrawal 14 • Settled 5 Data Time Period: 07/07 through 06/08 Source: L&I
Deploy Workforce Outcomes: Staff know job expectations, how they’re doing, & are supported. Workplace is safe, gives capacity to perform, & fosters productive relations. Employee time and talent is used effectively. Employees are motivated. Performance Measures Percent employees with current performance expectations Employee survey ratings on “productive workplace” questions Overtime usage Sick leave usage Non-disciplinary grievances/appeals filed and disposition (outcomes) Worker safety Department of Labor and Industries Non-Disciplinary Appeals (mostly non-represented employees) Agency Priority: Low Filings with Personnel Resources Board 2 Job classification 0 Other exceptions to Director Review 0 Layoff 0 Disability separation 0 Non-disciplinary separation 2 Total filings Non-Disciplinary appeals only are shown above. Filings for DOP Director’s Review 11 Job classification 0 Rule violation 1 Name removal from register 0 Rejection of job application 1 Remedial action 13 Total filings There is no one-to-one correlation between the filings shown above and the outcomes displayed in the charts below. The time lag between filing date and when a decision is rendered can cross the time periods indicated. Total outcomes = 11 Total outcomes = 3 Data Time Period: 07/07 through 06/08 Source: Department of Personnel
Deploy Workforce Outcomes Staff know job expectations, how they’re doing, & are supported. Workplace is safe, gives capacity to perform, & fosters productive relations. Employee time and talent is used effectively. Employees are motivated. Performance Measures Percent employees with current performance expectations Employee survey ratings on 'productive workplace' questions Overtime usage Sick leave usage Non-disciplinary grievances/appeals filed and disposition outcomes Worker Safety Department of Labor and Industries Worker Safety: Labor and Industries, Department of • Analysis: • L&I is significantly below the statewide roll-up numbers, displayed below from first quarter 2006 to the present. • Compensable claims are claims where employees lose time from work. All claims includes medical only claims. • Action Plan: • Continue to monitor. • Downward trend in all lines is desirable. Annual Claims Rate: Annual claims rate is the number of accepted claims for every 200,000 hours of payroll 200,000 hours is roughly equivalent to the numbers of yearly payroll hours for 100 FTE All rates as of 06-30-2008 Accepted Claims by Occupational Injury and Illness Classification System (OIICS) Event: calendar year-quarter 2003Q1 through 2007Q4 (categories under 3%, or not adequately coded, are grouped into 'Misc.') Cumulative Trauma Claims Source: Labor & Industries, Research and Data Services (data as of 06/30/2008 )
Develop Workforce Outcomes: A learning environment is created. Employees are engaged in professional development and seek to learn. Employees have competencies needed for present job and future advancement. Performance Measures Percent employees with current individual development plans Employee survey ratings on “learning & development” questions Competency gap analysis (TBD) Department of Labor and Industries Individual Development Plans Agency Priority: High • Analysis: • From Goal 6, 2007 – 2011 Strategic Plan • 3. Promote a work environment that optimizes the use of talent, provides fair and equal opportunity to all and encourages employees to excel. • We seek a diverse workforce that reflects the communities we serve. We employ tools, training and incentives, such as tuition reimbursement, to develop our existing talent and adapt employee skills and capabilities to meet future service requirements. When fully implemented, every employee will have an individual development plan that is current, relates to program and agency objectives, and contains clearly defined success factors. Percent employees with current individual development plans = 87%* *Based on 2130 of 2436 reported employee count Applies to employees in permanent positions, both WMS & GS Employee Survey “Learning & Development” Ratings Agency Priority: Medium Action Steps: • Devise and implement an effective method for tracking and reporting data related to performance, including completed evaluations, evaluations due, updated expectations, updated development plans. Data as of 06/08 Source: L&I; Agency Employee Survey
Reinforce Performance Outcomes: Employees know how their performance contributes to the goals of the organization. Strong performance is rewarded; poor performance is eliminated. Successful performance is differentiated and strengthened. Employees are held accountable. Performance Measures Percent employees with current performance evaluations Employee survey ratings on “performance and accountability” questions Disciplinary actions and reasons, disciplinary grievances/appeals filed and disposition (outcomes) Reward and recognition practices (TBD) Department of Labor and Industries Current Performance Evaluations Agency Priority: High • Analysis: • The percent of employees with current performance evaluations is a disingenuous number. • As calculated for this report, the number necessarily reduces as the workforce turns over, or employees move from division to division. • What was in excess of 95% in October 2007 has reduced to 87% in June 2008. • Action Steps: • Devise and implement an effective method for tracking and reporting data related to performance, including completed evaluations, evaluations due, updated expectations, updated development plans. Percent employees with current performance evaluations = 87%* *Based on 2130 of 2436 reported employee count Applies to employees in permanent positions, both WMS & GS Data as of 06/08 Source: L&I
Reinforce Performance Outcomes: Employees know how their performance contributes to the goals of the organization. Strong performance is rewarded; poor performance is eliminated. Successful performance is differentiated and strengthened. Employees are held accountable. Performance Measures Percent employees with current performance evaluations Employee survey ratings on “performance and accountability” questions Disciplinary actions and reasons, disciplinary grievances/appeals filed and disposition (outcomes) Reward and recognition practices (TBD) Department of Labor and Industries Employee Survey “Performance & Accountability” Ratings Agency Priority: High • Analysis: • Responses to questions 9 and 10 prompted L&I to adopt a more pro-active stance toward performance management. • The agency adopted a single 90-day window during which all performance evaluations are completed, expectations for the ensuing rating period and individual development plans are recorded. • During FY 2008, L&I recorded a 96% completion rate for evaluations and expectations. The number dropped in successive months due to shifting population and “new” employees who had not been evaluated. • L&I adopted a fixed population for FY 2009 tracking. Action Steps: • Quality in evaluations and progress reviews is high priority for L&I supervisors. Data as of 12/07 Source: Agency Employee Survey
Reinforce Performance Outcomes: Employees know how their performance contributes to the goals of the organization. Strong performance is rewarded; poor performance is eliminated. Successful performance is differentiated and strengthened. Employees are held accountable. Performance Measures Percent employees with current performance evaluations Employee survey ratings on “performance and accountability” questions Disciplinary actions and reasons, disciplinary grievances/appeals filed and disposition (outcomes) Reward and recognition practices (TBD) Department of Labor and Industries Formal Disciplinary Actions Agency Priority: Low • Analysis: • Disciplinary actions are expected in employment. • There are no unexpected actions to report, however there were unanticipated participants. Action Steps: • Continue to monitor. Disciplinary Action Taken * Reduction in Pay is not currently available as an action in HRMS/BI. • Issues Leading to Disciplinary Action • Failure to perform to expectation. • Inappropriate workplace behavior. • Dishonesty. • Misuse of equipment/resources. Data Time Period: 07/07 through 06/08 Source: DOP HRMS
Reinforce Performance Outcomes: Employees know how their performance contributes to the goals of the organization. Strong performance is rewarded; poor performance is eliminated. Successful performance is differentiated and strengthened. Employees are held accountable. Performance Measures Percent employees with current performance evaluations Employee survey ratings on “performance and accountability” questions Disciplinary actions and reasons, disciplinary grievances/appeals filed and disposition (outcomes) Reward and recognition practices (TBD) Department of Labor and Industries Disciplinary Grievances and Appeals Agency Priority: [High/Medium/Low] Disciplinary Grievances(Represented Employees) Disciplinary Appeals(Non-Represented Employeesfiled with Personnel Resources Board) 1 Dismissal 0 Demotion 0 Suspension 0 Reduction in salary 1 Total Disciplinary Appeals Filed with PRB Total # Disciplinary Grievances Filed: 13 There is no one-to-one correlation between the filings shown above and the outcomes displayed in the charts below. The time lag between filing date and when a decision is rendered can cross the time periods indicated. Disposition (Outcomes) of Disciplinary Appeals* Disposition (Outcomes) of Disciplinary Grievances • Withdrawn 2 • Settled 7 Withdrawn. *Outcomes issued by Personnel Resources Board Data Time Period: 07/07 through 06/08 Source: L&I
ULTIMATE OUTCOMES Employees are committed to the work they do and the goals of the organization Successful, productive employees are retained The state has the workforce breadth and depth needed for present and future success Performance Measures Employee survey ratings on “commitment” questions Turnover rates and types Turnover rate: key occupational categories Workforce diversity profile Retention measure (TBD) Department of Labor and Industries Employee Survey “Employee Commitment” Ratings Agency Priority: Medium • Analysis: • “Measures” and “recognition” are key issues to raising these survey results. Action Steps: • L&I’s accountability processes (GMAP) are public. Working with the Governor’s Office GMAP staff, L&I is making its internal process more transparent and more participative. • All performance expectations are required to be aligned with agency or program objectives and measures. • Supervisors are receiving training on rapid feedback techniques and longer-term programs for recognition. Data as of 12/07 Source: Agency Employee Survey
ULTIMATE OUTCOMES Employees are committed to the work they do and the goals of the organization Successful, productive employees are retained The state has the workforce breadth and depth needed for present and future success Performance Measures Employee survey ratings on “commitment” questions Turnover rates and types Turnover rate: key occupational categories Workforce diversity profile Retention measure (TBD) Department of Labor and Industries Turnover Rates Agency Priority: High • Analysis: • The reporting criterion for this measure is “leaving state service.” • Retention of employees in the enterprise is a valuable measure, but does not afford agencies an opportunity to measure program retention and turnover. • Variability in data entry procedures, abbreviations and interpretations make querying for separation type difficult and compromised reliability. Action Steps: • L&I has undertaken a broad data cleansing project to unify transaction coding, job class codes, organization coding and other data entry discrepancies. • Maintenance and cleansing of locally stored transaction data will provide reliable tracking of internal movement and movement between state agencies. Total % Turnover (leaving state) Total Turnover Actions: 182Total % Turnover: 6.7% Note: Movement to another agency is currently not available in HRMS/BI Data Time Period: 07/07 through 06/08 Source: DOP HRMS
ULTIMATE OUTCOMES Employees are committed to the work they do and the goals of the organization Successful, productive employees are retained The state has the workforce breadth and depth needed for present and future success Performance Measures Employee survey ratings on “commitment” questions Turnover rates and types Turnover rate: key occupational categories Workforce diversity profile Retention measure (TBD) Department of Labor and Industries Workforce Diversity Profile Agency Priority: Medium Agency State Female 58% 53% Persons w/Disabilities 7% 4% Vietnam Era Veterans 9% 6% Veterans w/Disabilities 3% 2% People of color 18% 18% Persons over 40 80% 75% • Analysis: • L&I is pleased with the overall diversity of its workforce. • The agency ‘s ethnic diversity is reflective of statewide diversity. • LNI’s ethnic diversity is reflective of the Thurston County labor pool. • The age distribution curve shows a disturbing lack of 18-25 year olds in the workforce. Action Steps: • Begin to compare regional workforce diversity to regional labor forces. • Initiate agency-wide diversity training, Fall 2008. • Verify and maintain recruitment and education efforts to high schools, vocational and technical schools and other post-secondary institutions. • Advance apprenticeship for state employment. • Continue to monitor. Data as of 06/08 Source: DOP HRMS
ULTIMATE OUTCOMES Employees are committed to the work they do and the goals of the organization Successful, productive employees are retained The state has the workforce breadth and depth needed for present and future success Performance Measures Employee survey ratings on “commitment” questions Turnover rates and types Turnover rate: key occupational categories Workforce diversity profile Retention measure (TBD) Department of Labor and Industries Workforce Diversity Profile Employee Survey “Support for a Diverse Workforce” Ratings Agency Priority: Medium • Analysis: • L&I is pleased with the response to this new survey question. Action Steps: • Continue efforts to support and increase the diversity of L&I’s workforce through training, education and exchange. • Begin to compare regional workforce diversity to regional labor forces. • Initiate agency-wide diversity training, Fall 2008. Data as of 12/07 Source: Agency Employee Survey


![State of Washington [Enter Agency Name] Human Resource Management Report](https://cdn3.slideserve.com/5876715/state-of-washington-enter-agency-name-human-resource-management-report-dt.jpg)

![State of Washington [ Enter Agency Name Here ] Human Resource Management Report](https://cdn3.slideserve.com/6591960/state-of-washington-enter-agency-name-here-human-resource-management-report-dt.jpg)