Download
1 / 11
410 likes | 813 Views
IGCSE P.1 Motion Prepared by- Uttam Maheshwari. Speed Velocity Graphs of Motion Acceleration. MOTION. Motion :- change in position of a body with time. . . x. 6 meters. Speed. Distance travelled in unit time

E N D
IGCSE P.1 MotionPrepared by- Uttam Maheshwari Speed Velocity Graphs of Motion Acceleration
MOTION Motion :- change in position of a body with time.
x
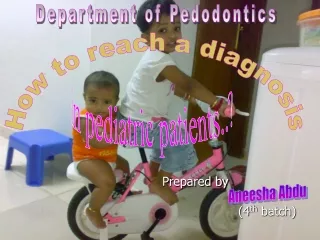
6 meters Speed • Distance travelled in unit time • a measure of how fast something moves, or the distance it moves, in a given amount of time • Formula: expressed in units of m/s • is considered average when taking into account the total distance covered and the total time of travel • is considered constant when it does not change S = d t 00:00. 0 1 2 3 4 5 6 What is the ball’s speed?
Describing motion and concept of 2 types D Distance :- is the actual length of the path travelled by an object or measurement of length without regard direction. Displacement :- is the length of the shortest path travelled by a body from its initial position to its final position. Eg :- If a body starts moving in a straight line from origin O and moves through C and B and reaches A and then moves back and reaches C through B, then show its distance travelled and displacement. O C B A 0 5 10 15 20 25 30 35 40 45 50 55 60 km
The slope or gradientof a distance-time graph increases with speed. distance fast slow time
The slope or gradientof a distance-time graph is equal to the speed. In the graph opposite: slope = 150m / 10s = 15 m/s = speed
CRQ Describe the motion of the three cars X, Y and Z shown in the graph below.
Distance Time Graphs Match x x x x t t t t • a stationary object • An object with a fast constant velocity • An object with a slow constant velocity • an object which is accelerating • The gradient of a distance time graph is its velocity • ie distance divided by time
The End Conceptualized by- MY SCIENCE TEAM Educator – Manish Tiwari & Uttam (IGCSE) Photo enhancement – Amazing animation EUREKA, SERENDIPITY,FORTUITY Location- Fountainhead School Surat Field research- MY Science team 2014 Fountainhead Productions