Download
1 / 7
130 likes | 678 Views
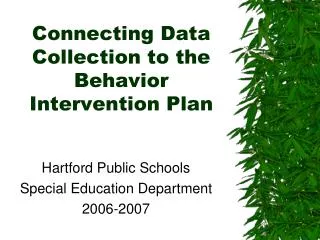
Writing a Behavior Intervention Plan (BIP). Seven Components of a BIP. Description of the Behavior Be specific Baseline Data Should be collected as part of the FBA Discuss Function of the Behavior Identify Replacement Behavior This will be written as the Specific Goal Be positive

E N D
Writing a Behavior Intervention Plan (BIP) Troup County School System Psychological Services Department
Seven Components of a BIP • Description of the Behavior • Be specific • Baseline Data • Should be collected as part of the FBA • Discuss Function of the Behavior • Identify Replacement Behavior • This will be written as the Specific Goal • Be positive • Teaching Component • This will be documented under Interventions • Document Reinforcers • This will be included under Rewards/Consequences • Document method of evaluation • Frequency data (i.e., how often behavior occurs) • Duration data (i.e., how long behavior occurs) Please see next slide for examples of each component
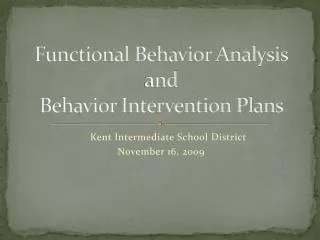
Troup County School SystemBehavior Intervention Plan Student’s Name: Speedy GonzalezDOB: 5-5-05Grade: Pre-K Date Plan Developed: 10-13-09 Target Behaviors (list specific observable behaviors):When he is verbally redirected by his classroom teacher, Speedy will tell the teacher “no”. If physically redirected, he will hit, kick, and/or bite his teacher. Results of the FBA indicate that Speedy wants to be in control and he is not use to following a structured schedule.Baseline data indicates that he will not comply with his teacher’s request within 5 minutes. Typically, he has to be removed from the classroom because he has a physical outburst when he is physically redirected. Specific Goal Interventions Rewards/ConsequencesMethod of Evaluation This slide provides examples of the seven components.
Things to Consider When Collecting Baseline Data • Baseline data should be collected as part of the FBA and prior to the implementation of the intervention. • Baseline data should document the target behavior. • When you write your goal in positive terms, it should be based on the frequency or intensity of the target behavior. • Data can also be represented by the data collected during the implementation of a prior intervention.
What to Measure When Collecting Baseline Data • You must consider what skills the student needs to demonstrate. • We typically measure the presence of the irritating, frustrating, or aggravating behavior. • However, we need to collect data that measures the desired skill and the disruptive behavior. • We need to measure the frequency or intensity/duration of the skill we want to see.
Examples of What to Measure • Student is constantly out of his seat • Collect frequency data comparing out of seat behavior for target student and other students of the same gender • Student hits, kicks, slaps others when redirected by teacher • Collect data that records the number of redirects AND the student’s response (i.e., appropriate or inappropriate) • When student transitions, she loses control and destroys the classroom • Collect data that records the frequency and duration of the behavior
Method of Evaluation • Frequency Graph (see handout #1) • This graph tells you how often a behavior occurs within a designate number of minutes. Be sure to enter a specific amount of time on the graph page. • This graph is designed to display the frequency of a behavior. • Duration Graph (see handout #2) • This graph tells you how long a behavior lasts. This is good to use in situations where the duration/intensity of a behavior is problematic not the frequency. • This graph documents duration and frequency of a behavior.