Download
1 / 12
120 likes | 250 Views
Neuroinformatics Research at UO. Experimental Methodology and Tool Integration. 16x256 bits per millisec (30MB/m). CT / MRI. segmented tissues. EEG. NetStation. BrainVoyager. processed EEG. mesh generation. source localization constrained to cortical surface. Interpolator 3D. EMSE.

E N D
Experimental Methodology and Tool Integration 16x256bits permillisec (30MB/m) CT / MRI segmentedtissues EEG NetStation BrainVoyager processed EEG mesh generation source localization constrained to cortical surface Interpolator 3D EMSE BESA
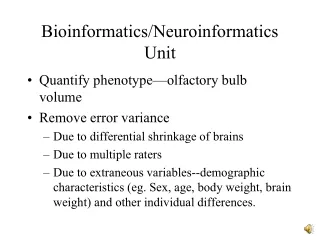
NeuroInformatics Center (NIC) at UO • Application of computational science methods to human neuroscience problems • Tools to help understand dynamic brain function • Tools to help diagnosis brain-related disorders • HPC simulation, large-scale data analysis, visualization • Integration of neuroimaging methods and technology • Need for coupled modeling (EEG/ERP, MR analysis) • Apply advanced statistical analysis (PCA, ICA) • Develop computational brain models (FDM, FEM) • Build source localization models (dipole, linear inverse) • Optimize temporal and spatial resolution • Internet-based capabilities for brain analysis services, data archiving, and data mining
Funding Support • BBMI federal appropriation • DoD Telemedicine Advanced Technology Research Center (TATRC) • $40 million research attracted by BBMI • $10 million gift from Robert and Beverly Lewis family • Established Lewis Center for Neuroimaging (LCNI) • NSF Major Research Instrumentation • “Acquisition of the Oregon ICONIC Grid for Integrated COgnitive Neuroscience Informatics and Computation” • New proposal • NIH Human Brain Project Neuroinformatics • “GENI: Grid-Enabled Neuroimaging Integration”
Electrical Geodesics Inc. (EGI) • EGI Geodesics Sensor Net • Dense-array sensor technology • 64/128/256 channels • 256-channel geodesics sensor net • AgCl plastic electrodes • Carbon fiber leads • Net Station • Advanced EEG/ERP data analysis • Stereotactic EEG sensor registration • Research and medical services • Epilepsy diagnosis, pre-surgical planning
NeuroInformatics for Brainwave Research • Electroencephalogram (EEG) • EEG time series analysis • Event-related potentials (ERP) • Averaging to increase SNR • Linking brain activity to sensory–motor, cognitive functions (e.g., visual processing, response programming) • Signal cleaning (removal of noncephalic signal, “noise”) • Signal decomposition (PCA, ICA, etc.) • Neural Source localization
APECS: A new tool for EEG data decomposition • Automated Protocol for Electromagnetic Component Separation • Motivation • EEG data cleaning (increases SNR) • Separation of EEG components (addresses superposition) • Data preprocessing prior to source localization • Distinctive Features • Implements variety of algorithms (PCA, ICA, SOBI, etc.) • Uses multiple metricsfor fast, automatic classification of extracted components • Applies multiple criteria toevaluate success of decomposition (to ensure that artifacts are cleanly separated from cortical activity) • Calls high-performance, parallel C++ implementations of Infomax and FastICA algorithms
APECS Evaluation: Quantitative Criteria Covariance between “baseline” (blink-free) and ICA-filtered data. Yellow, Infomax; blue, FastICA. Infomax gives consistently better results. FastICA results are more variable. ICA decompositions most successful when only one spatial projector is strongly correlated with blink “template” (spatial filter).
High-Performance ICA Parallel FastICA: Over 130 times faster than MATLAB fastica.m Greater than 8-fold increase in performance on 32 processors Parallel Infomax: Over 3 times faster than MATLAB runica.m Greater than 3-fold increase in performance on 4 processors
Brain, Machine, and Education • Pittsburgh Science of Learning Center (PSCL) Collaboration • http://pslc.hcii.cs.cmu.edu/tiki-index.php • LearnLab Research Facility (U. Pittsburgh, CMU) • Authoring tools for online courses, experiments, and integrated computational learner models • Support for running in vivo learning experiments • Longitudinal microgenetic data from entire courses • Data analysis tools, including software for learning curve analysis and semi-automated coding of verbal data • Parallel studies of learning using cognitive neuroscience (EEG, fMRI) methods • Multidisciplinary Effort • Computer Science (e.g., Maxine Eskanazi, Jamie Callan — CMU) • Linguistics & ESL (e.g., Alan Juffs — U. Pittsburgh ) • Psychology (Charles Perfetti — U. Pittsburgh)