Download
1 / 22
220 likes | 337 Views
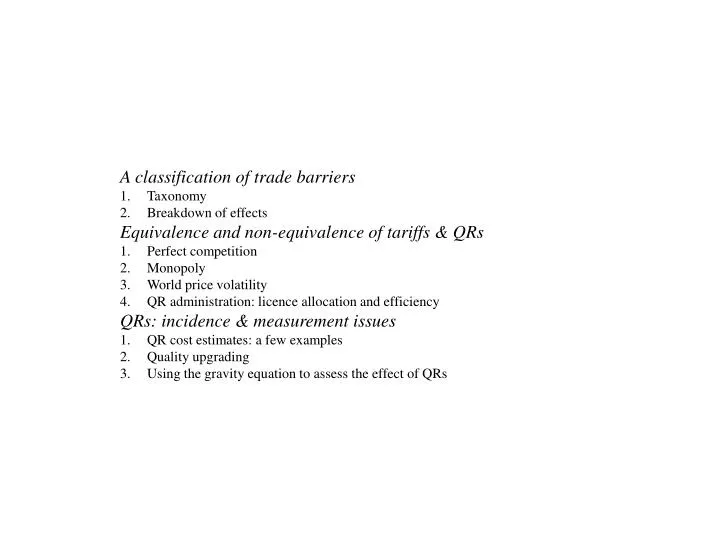
A classification of trade barriers Taxonomy Breakdown of effects Equivalence and non-equivalence of tariffs & QRs Perfect competition Monopoly World price volatility QR administration: licence allocation and efficiency QRs: incidence & measurement issues QR cost estimates: a few examples

E N D
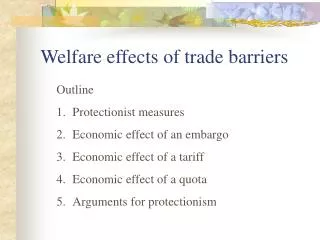
A classification of trade barriers • Taxonomy • Breakdown of effects • Equivalence and non-equivalence of tariffs & QRs • Perfect competition • Monopoly • World price volatility • QR administration: licence allocation and efficiency • QRs: incidence & measurement issues • QR cost estimates: a few examples • Quality upgrading • Using the gravity equation to assess the effect of QRs
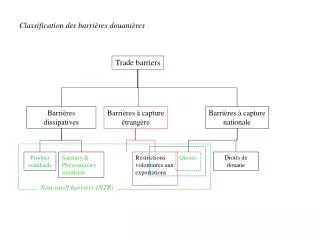
A Classification of trade barriers • Taxonomy Trade barriers “Dissipative” barriers “Foreign-capture” barriers “Domestic-capture” barriers Technical Barriers to Trade Sanitary & Phytosanitary standards Price undertakings VERs Quotas • Noncontingent tariffs: • MFN • Preferential • Contingent tariffs: • antidumping • countervailing • safeguard clauses Quantitative Restrictions (QR) Non-tariff barriers (NTB)
World price plus tariff Tariff A B C D Quantity imported • Equivalence and non-equivalence of tariffs & QRs • Perfect competition • Tariff under competition Prices Domestic demand Marginal cost World price Quantities
Equivalence and non-equivalence of tariffs & QRs • Perfect competition • Quota under competition Prices Domestic demand Residual (after-quota) demand Marginal cost Domestic price A C B D World price Quantities Quota
World price plus tariff Tariff A B C D World price Quantity imported Equivalence and non-equivalence of tariffs & QRs 2. Monopoly Tariff under monopoly Prices Domestic demand Marginal revenue Marginal cost Quantities
C D A Quota B Equivalence and non-equivalence of tariffs & QRs 2. Monopoly Quota under monopoly Prices Domestic demand Residual (after-quota) domestic demand Marginal cost Domestic price World price Quantities
Use of Non-Tariff Barriers (NTBs) (a) Ad-valorem equivalent of core NTBs, by GDP/capita of using country (b) AVE of agricultural price-support measures Source: Kee, Nicita & Olarreaga 2006a
Equivalence and non-equivalence of tariffs & QRs 3. World price volatility Tariff at low price Prices Domestic demand Marginal cost Tariff Low world price Quantities
Equivalence and non-equivalence of tariffs & QRs 3. World price volatility Tariff at high price Prices Domestic demand Marginal cost Tariff High world price Quantities
Equivalence and non-equivalence of tariffs & QRs 3. World price volatility Quota at low price Prices Domestic demand Marginal cost Domestic price Low world price Quantities Quota
Equivalence and non-equivalence of tariffs & QRs 3. World price volatility Quota at high price Prices Domestic demand Marginal cost High world price = domestic price Quantities Quota (not binding) Actual imports
Overall protection: OTRI and MA-OTRI Define Overall Trade Restrictiveness Index (OTRI) as uniform tariff that gives same level of imports as all current barriers: Existing barriers (tariffs + AVE of NTBs) OTRI Source: Kee, Nicita & Olarreaga 2006a
OTRI and MA-OTRI by level of income (a) OTRI (b) MA-OTRI
Overall protection: OTRI and MA-OTRI in agriculture Source: Kee, Nicita & Olarreaga 2006a
“Third-country” tariff-quota 2.2 m tons @ 75 ECU/ton ACP quota tariff-free 857,700 tons EU OST quota price support 854,000 tons Exporting country breakdown • “F.A. countries”: • Costa Rica 23.4% • Columbia 21% • Nicaragua 3% • Venezuela 2% Other countries 50.6% - 90,000 tons Dom. Rep. Belize Ivory Coast Cameroon 90,000 tons Licence allocation breakdown (by type of operator) Category C: 3.5% New entrants Category A: 66.5% “Dollar” importers Category B: 30% ACP/OST importers Primary importers 57% Custom clearers/ ripeners 43% QRs: incidence and measurement issues 2. Using the gravity equation to assess the effect of QRs Bananas
(a) (tariff-quota) €/ton SEU SACP pEU S$(t) S$ p* + t p* DEU Million tons QEU Q$ = 2.65 QACP = 0.85 Rent-sharing (a) (tariff-quota) €/ton SEU SACP pEU S$(t) Total rents S$ p* + t p* DEU Rents to US companies Million tons Rents to European companies QEU Q$ = 2.65 QACP = 0.85
(a) (tariff-quota) €/ton SEU SACP pEU S$(t) tPG S$ p* + t p* DEU €75/t in-quota tariff Million tons QEU Q$ = 2.65 QACP = 0.85 (b) (tariff only at rate tPG) €/ton SACP SACP+ SEU SACP + SEU + S$ (tPG) pEU tPG S$ DEU (b) (tariff only at rate tPG) €/ton SACP SEU S$ (tPG) pEU tPG S$ DEU Million tons QACP > 0.8 Q$ < 2.65 QEU
The gravity model of international trade Distant Large country Large country Close by Small country Distant Distant Large country
Estimating the price effect of QRs: bananas 2. Interpreting the gravity estimates: trade-reduction effect of QR
Estimating the price effect of QRs: bananas 2. Interpreting the gravity estimates: tariff equivalent of QR
“Tariffication” of a quota: EU bananas Gravity estimation