Download
1 / 22
220 likes | 322 Views
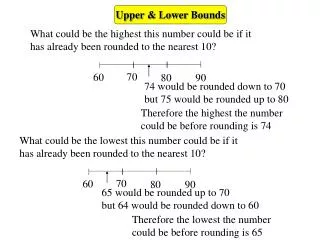
Trends in the Upper Stratosphere - Lower Mesosphere. Philippe Keckhut, Chantal Claud, Bill Randel, NOAA/CPC. Temperature trends 1979-1994. STTA-SPARC Ramaswamy et a., Rev. Geoph., 2001 MTTA/IAGA-ICMA Beig et al, Rev. Geoph., 2003. Significant trends 1-3 K/decade

E N D
Trends in the Upper Stratosphere - Lower Mesosphere Philippe Keckhut, Chantal Claud, Bill Randel, NOAA/CPC
Temperature trends 1979-1994 STTA-SPARC Ramaswamy et a., Rev. Geoph., 2001 MTTA/IAGA-ICMA Beig et al, Rev. Geoph., 2003 • Significant trends • 1-3 K/decade • Homogeneous from 8°s to 44°N Rockets 8°S-34°N Keckhut et al., J. Geophys. Res., p447, 1999 Lidar OHP 44°N Beig et al, Rev. Geoph., 2003
Instrumental changes on soviet rocket • Volgograd sensor changes Corrected data Raw data Estimated from the time serie analyses Kubicki et al., submitted toJASTP, 2004. Estimated from the aerothermic calculations
Tidal interferences + Solar heating or other biais related with Solar time 6K Keckhut et al., J. Geophys. Res., p10299, 1996 They induce large interferences in data comparisons, trends and satellite validations Keckhut et al., J. Geophys. Res., p447, 1999
Tidal interferences • Volgograd 15:00 10:00 2:00 Averaged temperature 45-55 km Time of launch Kubicki et al., submitted toJASTP , 2004.
Global trend estimates NCEP analyses at 1 hPa (≈50 km) • NCEP/NOAA analyses appear to be biased by tides • SSU-Nash is probably not biased, but provides only zonal means. Keckhut et al., J. Geophys. Res., p546, 2001
Tidal variability • The use of tidal models ? Tidal variability ? • Data assimilation? Tidal representation 3D Rose/Reprobus model at SA • Reproduce realistic tides • Tidal variability is around 20% • Tidal variability can be reproduced with realistic ozone and water vapor fields and planetary waves forcing Diurnal Semi-diurnal Morel et al., JASTP, p251, 2004
The multi-parameter regressions (AMOUNTS)(Hauchecorne et al., 1991; Keckhut et al., 1995) • To evaluate temperature trends and variability (for data and model outputs) and Spurious changes, it is necessary to parametrize the variability: • T(t) = m + St + A•Trend • + B•Solar + C•QBO + D•ENSO + E•AO • + F.Step(ti) + Nt • The A, B, C, D, E, F terms represent the amplitude of trends / factors of variability and bias. • The residuals (AR(1)) include all the variability not considered in the parametrization. • The analysis of the residual terms : • model inadequacies • the degree of confidence of the analysis • Data are filtered according to time of the day
Heiss Island Trends Trends are similar with Volgograd
Trends as a function of latitude Wallops, --- Wallops OHP US tropical °°°° OHP, _ _ US tropical Volgograd Volgograd Summer Winter Riory Riory, …. US tropical: 8°S-34°N Wallops Island: 37,5°N Ryori, Japan: 39°N OHP, France 44°N Volgograd 49°N Kubicki et al., submitted toJASTP, 2004.
Updated stratospheric temps from SSU/MSU SSU47x note ‘flattening’ of trends near stratopause SSU35x SSU25 small long-term cooling in middle stratosphere SSU15x MSU4 * Thanks to John Nash (MetO), Jim Miller, Mel Gelman and Roger Lin (NOAA CPC)
Upper stratosphere: SSU vs. HALOE SSU 47x ~43-57 km HALOE integrated to approximate SSU 47x
Stratospheric Sounding Unit (SSU)* operational measurements since 1979 * ~10-15 km thick layer temperatures synthetic channels
Other NDSC lidar data sets 47X 36X 35X
La Réunion lidar station 21°S • Warming of around 2 K/decade • In agreement with SSU • Only 10 years
Bill: How do we interpret stratopause variability? ~43-57 km ?
Bill: How do we interpret stratopause variability? ~43-57 km ?
Methodologic error • The methodologic error is strongly related to the noise level • After 20 years methodologic errors are negligeable • Non linear trend estimates are possible • on domain 2 and depend on data length and residual noise and • on domain 3 only related to residual noise Kerzenmacher et al., QJSRT, 2005
Three types of data sets Rocket 1970-1990 Lidar 1990-2005 SSU 1979-2005 Discontinuities Rocket : pb with time of measurements and sensor changes Lidar : autocalibrated, darktime measurements, larger biais around 30 and 70-80 km SSU/NCEP: Tides R and L in good agreement with SSU around 50 km larger trends in tropics around 25-35 km Flattering after 1995 in good agreement with NDSC Lidars. Need more investigations. How to take into account slope changes: use ozone data as forcing. Conclusions