Download
1 / 45
490 likes | 803 Views
harvesting wind energy in a city. MSc Christina Beller Wind Energy Division, AED Risø DTU National Laboratory for Sustainable Energy Wind Energy Division, P.O. Box 49, 4000 Roskilde, Denmark Tel: +45 4677 5434, e-mail: cbel@risoe.dtu.dk. Content. Introduction Urban Wind Turbines

E N D
harvesting windenergy in a city MSc Christina Beller Wind Energy Division, AED Risø DTU National Laboratory for Sustainable Energy Wind Energy Division, P.O. Box 49, 4000 Roskilde, Denmark Tel: +45 4677 5434, e-mail: cbel@risoe.dtu.dk
Content • Introduction • Urban Wind Turbines • Wind Conditions Grøn BIM
INTRODUCTION Grøn BIM
Wind Energy History 4 Grøn BIM
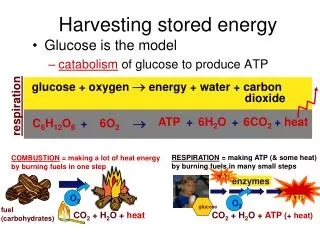
Key Figures within Wind Energy Production-rotor design- The idea with a wind turbine is to transform some of the energy in the wind in useable energy theory power production: maximum power coefficient: P = ½ v3 A CP CP=16/27=0.593 in practice maximum power coefficient small WT in the kW range have a CP=0.5 for MW turbines maximum CP between 0.3 and 0.4. http://www.flatrock.org.nz/topics/environment/energy_options.htm http://logik.dk/site/referencer/referencer-byvindmoller Grøn BIM
Key Figures within Wind Energy Production-siting- Load factor: actual power output at specific site/ maximum rated output Load factor ~30%-40% Load factor ~10% for small-scale for off-shore MW turbines [1] building mounted WT and ~17% for free standing turbines [1] A wind field trial in UK showed, that the 57 domestic installed wind turbines reached up to a load factor of only ~3%. Among the monitored wind turbines, a 1.5kW building mounted wind turbine had the maximum load factor yield with 7.4%. [1] http://www.energysavingtrust.org.uk/Global-Data/Publications/Location-location-location-The-Energy-Saving-Trust-s-field-trial-report-on-domestic-wind-turbines Grøn BIM
CalculationExample annual energy consumption single house hold: 1800 kWh/year 2 persons: 2500 kWh/year 4 persons: 4000 kWh/year annual energy production a 1kW WT produces according to wind climate, positioning and design: 24h * 365days * rated power * load factor = 700kWh/year that corresponds to ca. 200kWh/year per m2 (3.61m2 in total) and to about 28% of the energy needs of a 2 persons house hold a 2MW WT positioned off-shore (e.g.Middelgrund) produces approximarely: 24h * 365days *rated power * load factor = 5256000kWh/year that corresponds to ca. 1168kWh/year per m2 (4500m2 in total) and to about 100% of 2100 house holds with two persons Grøn BIM
public - streetlamps - city bikes - fountaines - … private - lowvoltagegrid(12V/24V) - private power plant generel, energyshould not vanish in the grid, no new needsshallbeinvented and directconnectionbetween generation and usageshallbemaintained 230V bruger 12V 12V 230V bruger 230V bruger … 230V 12V bruger Howshould the Energy beused 8 Grøn BIM
Urban Wind turbines Grøn BIM
Wind Energy in the Urban Environment conceptstudy twoProven6 horizontalwind turbines, Blackpool, UK verticalwind turbine on a flatroof, UK 10 Grøn BIM • Integrated in buildingsstructure • Mountedonalreadyexistingbuildings • Freestanding turbines
Example for integrated Designs Bahrain World Trade Center in Bahrain, designed by The Atkins Note: Three 29m diameter wind turbines aresupposed to deliver 11-15% of the energyneeds of the building. www.bahrainwtc.com Grøn BIM
More Examples for integrated Designs STRATA (formerlyknown as Castle House) in London, designed by BFLS (formerly Hamilton Architects) Note: The three 9m diameter wind turbines areestimated to deliver 8% of the energyneeds of the building. http://www.stratalondon.com/home Grøn BIM
More Examples for integrated Designs Pearl River Tower in Guangzhou, China, designed by: SOM Note: Besideswind turbines in the slots, photovoltaicsareintegrated (BIPVs) in the facade. Theyprovideabout10% of the energyconsumption. http://www.som.com http://www.bryanchristiedesign.com/portfolio.php?illustration=576&category=37&open= Grøn BIM
More Examples for integrated Designs COR in MIAMI, designed by: Oppenheim Architecture + Design Grøn BIM
most projects were feasibility studiesand were not continued Some manufacturers made promises to customer, which they could not fulfill bad reputation for the branch of small wind turbines In the end UKgot pretty active in the area of small or so-called micro wind turbines sizes range from 1 to 20m diameter and the rated power from 100Wto 100kW to get the peoples acceptance, the design has to be aesthetic and reliable Turbines mounted on existing Buildings QuietRevolution, UK vertikale møller, UK Proven, UK 15 Grøn BIM
Use the energy for public needs Not necessarily connected to a building Prevent that neighbors get irritated, while they do not gain anything from it Usage shouldserve everybody example Blackpool: Spectacular lightning in the city – supported by decentralized wind energy of two “Proven 6” turbines positioned at coastal site, like Copenhagen Free standing Wind Turbines Lakes in Copenhagen 16 Grøn BIM
Vertical axis H-rotor typeQuiet Revolution (6kW) Manufacturer: QuietRevolution Concept: 3 bladed lift-driven Axis: Vertical axis Rated Power (at 12.5m/s): 6.0kW Diameter: 3.1m Height: 5.0m Swept area: 15.5m2 http://www.quietrevolution.co.uk/qr5.htm Grøn BIM
GODKENDT i DK Vertical axis H-rotor typeVenco Twister 1000T/1000TL(1kW) Manufacturer: Venco Concept: 3 bladed lift-driven Axis: Vertical axis Rated Power (at 12m/s): 1.0kW Diameter: 1.9m Height: 1.9m Swept area: 3.6m2 http://logik.dk/site/referencer/referencer-byvindmoller Grøn BIM
Vertical axis H-rotor typeMariah Power (1.2kW) Manufacturer: Mariah Power Concept: 3 bladed lift-driven Axis: Vertical axis Rated Power (at 11.2m/s): 1.2kW Diameter: 1.2m Height: 6.1m Swept area: 7.3m2 http://www.mariahpower.com/windspire-overview.aspx Grøn BIM
”Verticalaxis” Savonius/H-rotor typeAerotecture (1kW) Manufacturer: Aerotecture Concept: 2 bladed drag-lift hybrid Axis: Tilted Vertical axis Rated Power (at 14m/s): 1.0kW Diameter: 1.5m Height: 2.8m Swept area: 4.2m2 http://www.aerotecture.com/products_520H.html Grøn BIM
GODKENDT i DK Horizontal axis up-wind and passive yawing proCure (600W) Manufacturer: proCure A/S Concept: 3 bladed up-wind lift-driven Yaw Control: Passive Axis: Horizontal Rated Power (at 12.5m/s): 0.6kW Diameter: 1.8m Swept Area: 2.5m2 http://www.procure.dk/moeller.htm Grøn BIM
Horizontal axis up-wind and active yawing Wind Energy Solutions (2.5kW) Manufacturer: Wind Energy Solutions Concept: 3 bladed up-wind lift-driven Yaw Control: Active Axis: Horizontal Rated Power (at 9m/s): 2.5kW Diameter: 5.0m Swept Area: 19.6m2 http://www.windenergysolutions.nl/files/foto/big/tu1.jpg Grøn BIM
Horizontalaxisup-windBellAIR (3W) Concept: 2 bladed up-wind lift-driven Axis: horizontal Rated Power (at 7m/s):3W Diameter: 0.27m Swept Area: 0.06m2 Grøn BIM
Horizontalaxisup-windBellAIR (3W) Mounted on, e.g. a bike, the citizen is cycling and generating most of the wind. While the bike is parked and wind is blowing, energy is produced, meant to charge small electrical items. Grøn BIM
Wind conditions Grøn BIM
Wind ClimateOn-Shore Grøn BIM
Wind Climate in Cities Wind inbetween and aroundbuildings windprofiles H.C. Ørsteds instituteroof top, windrose 27 Grøn BIM
Parametric City Grøn BIM
Parametric City-quarterclassification- [2] Badde O, Plate EJ (1994) Einfluss verschiedener Bebauungsmuster auf die windinduzierte Gebäudebelastung. In: Abschlusskolloquium Strömungsmechanische Bemessungsgrundlagen für Bauwerke. University of Karlsruhe Grøn BIM
Parametric City-configuration seven- Grøn BIM
Parametric City-pressure distribution- Flow direction: α = 90⁰ Pressure distribution on the surface. Red: Areas of high pressure indicating low velocities. Blue: Areas of low pressure indicating high velocities. Grøn BIM
Parametric City-streamlines 1- Flow direction: α = 90⁰ Streamlines surrounding the obstacle. Accelerated flow in the entrance urban canyon, not maintained, but lifted up over the rear building. Grøn BIM
Parametric City-streamlines 2- Flow direction: α = 90⁰ Streamlines sharply decelerated at the facade (high pressure). Main parts surround the building, loosing velocity in the wake areas of the array. A small fraction flows over the buildings roof top and gets accelerated at the edge (low pressure). Grøn BIM
Parametric City-streamlines 3- Flow direction: α = 90⁰ Streamlines hitting the outstanding tower are deflected. Anyway, a reasonable speed is maintained. Grøn BIM
Parametric City-streamlines 4- Flow direction: α = 90⁰ Parts of the streamlines are deflected downwards at the tower’s façade and get decelerated remarkable. Grøn BIM
Parametric City-streamlines 5- Flow direction: α = 90⁰ Flow over in-line obstacles of a constant high remains undisturbed, but slightly lifted in height gradually. Grøn BIM
Parametric City-stamps 1- Flow direction: α = 90⁰ First row: High speeds due to undisturbed inflow. Grøn BIM
Parametric City-stamps 2- Flow direction: α = 90⁰ First row: The undisturbed flow is deflected strongly at the first row’s façade, forming a speed profile on the roof top’s front edge. Second/third row: Buildings inside the array and of the same height as their up-steam buildings experience homogeneous speed distributions along the roof top Grøn BIM
Parametric City-stamps 3- Flow direction: α = 90⁰ Speed distributions above roof level are maintained in areas with buildings of the same height, although distances may vary to a certain extend. Grøn BIM
Parametric City-stamps 4- Flow direction: α = 90⁰ Outstanding buildings: The part of a building higher than the up-stream building experiences the ‘first-row’ effect. Buildings behind them: In wake areas the flow is more turbulent and the speed is very low. The wake recovers depending on the down-stream situation. Grøn BIM
Parametric City-overview- Flow direction: α = 90⁰ Grøn BIM
Parametric City-meterological masts- 270 180 pole2 pole3 pole1 000 090 SEB'10 Christina Beller
Parametric City-meterological masts- SEB'10 Christina Beller
Parametric City-meterological masts- SEB'10 Christina Beller
Wind Turbines in Urban Environment • Christina Beller, Urban Wind Energy – State of the Art 2009, Risø-R-1668(EN), October 2009 Grøn BIM