Download
1 / 47
470 likes | 663 Views
Economics in Forestry. John Perez-Garcia Guest Lecture ESRM 101 – May 22, 2007. Economics. Allocation of scarce resources If there is no scarcity, there is no problem Scarcity rent Externalities Willingness to Pay. The Different Aspects of Forest Economics. Production Economics

E N D
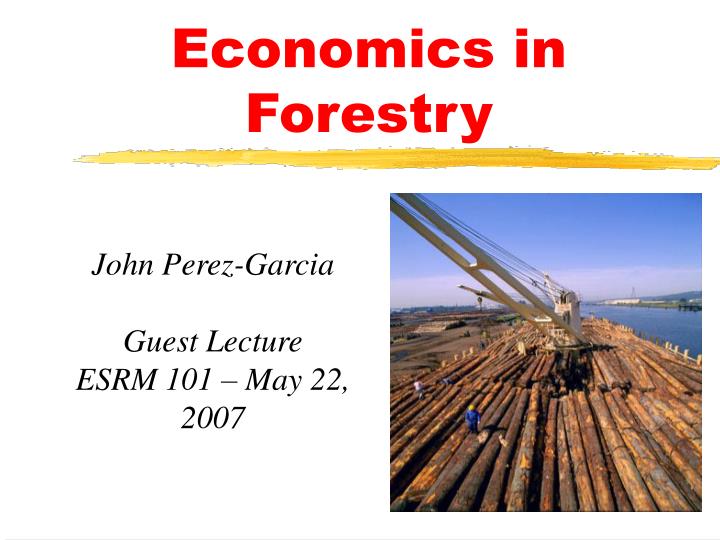
Economics in Forestry John Perez-Garcia Guest Lecture ESRM 101 – May 22, 2007
Economics • Allocation of scarce resources • If there is no scarcity, there is no problem • Scarcity rent • Externalities • Willingness to Pay
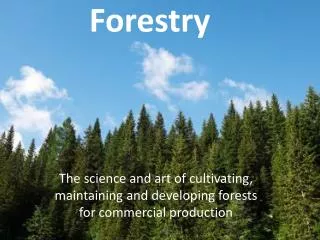
The Different Aspects of Forest Economics • Production Economics • Timber supply: How to meet growing demand for wood products • Environmental Economics • How much of environmental services to produce (i.e. carbon, biodiversity)
The Supply and Demand of Forest Products Worldwide Finland Sweden Former Soviet Union, West and East (SUW, SUE) Canada (see Map 3) United States Western Europe (EUW) Japan China Korea Central America Eastern Europe (EUE) and Mexico (CAM) Taiwan-Hong Kong Middle East Philippines (MDE) (PHL) India (IND) Africa North (AFN) Indochina (ICH) Northern South America Malaysia East Malaysia West (MAW) (SAN) (MAE) Indonesia (IDN) Brazil Papua New Guinea (PNG) Rest of Oceania (OCN) Africa West (AFW) East Africa (BRA) (AFE) Australia (AUS) Chile Southern South America (SAS) Africa South (AFS) New Zealand
Key Consumers Finland Sweden Former Soviet Union, West and East (SUW, SUE) Canada (see Map 3) United States Western Europe (EUW) Japan China Korea Central America Eastern Europe (EUE) and Mexico (CAM) Taiwan-Hong Kong Middle East Philippines (MDE) (PHL) India (IND) Africa North (AFN) Indochina (ICH) Northern South America Malaysia East Malaysia West (MAW) (SAN) (MAE) Indonesia (IDN) Brazil Papua New Guinea (PNG) Rest of Oceania (OCN) Africa West (AFW) East Africa (BRA) (AFE) Australia (AUS) Chile Southern South America (SAS) Africa South (AFS) New Zealand
New Suppliers Servicing Pacific Rim Markets Finland Sweden Former Soviet Union, West and East (SUW, SUE) Canada (see Map 3) United States (see Map 2) Western Europe (EUW) Japan (JPN) China (CHN) Korea (KOR) Taiwan-Hong Kong Central America (THK) Eastern Europe (EUE) and Mexico (CAM) Middle East Philippines (MDE) (PHL) India (IND) Africa North (AFN) Indochina (ICH) Northern South America Malaysia East Malaysia West (MAW) (SAN) (MAE) Indonesia (IDN) Brazil Papua New Guinea (PNG) Rest of Oceania (OCN) Africa West (AFW) East Africa (BRA) (AFE) Australia (AUS) Chile Southern South America (SAS) Africa South (AFS) New Zealand
An Alternative Projection 2000 1995 2010 1800 1.4% 1600 0.5% Million Cubic Meters 1400 1200 1000 1975 1982 800 5 15 25 35 45 55 GDP (1995 US Trillion $ PPP)
Global Capacity Surplus at the End of the Decade 2000 1995 2010 1800 1.4% 1600 Capacity Expansion 0.5% Million Cubic Meters 1400 1200 Capacity Contraction 1000 1975 1982 800 5 15 25 35 45 55 GDP (1995 US Trillion $ PPP)
On the Road to Recovery • Recovery from a global recession • US domestic market strong • Weakening dollar puts pressure on importers to US
Projections for Demand Growth • Mid term projection: 300 to 800 MMm3 • (60 BBbf to 160 BBbf)
Global Supply Analysis • Which regions will supply this increment • Depends on available resources • Location • Infrastructure
Supply-side Players • Old Guard • Pacific Northwest • Alaska • Russia • New Guard • Chile/New Zealand • Scandinavia (Sweden/Finland)
New Plantations • Latin America • Uruguay, Argentina, • Chile, Brazil • Asia • Australia, New Zealand, • Indonesia, China
Inventory Projections Uruguay Chile Argentina Brazil
Inventory Projections New Zealand Australia Indonesia China
Supply Demand Balance Total Volume In Age Classes Greater Than Rotation Age
Supply Analysis with Global Trade Simulation Model • Adds economic parameters to physical resources • Allows trade flows • Considers harvesting and delivery costs • Not limited to newly established plantations • Analysis assumes no growth in demand
Who Will Supply the Next Increment of Softwood Sawlogs Based on cost competitiveness for 2010 Million Cubic Meters
Supply and Demand Balance 0.3 - 1 Finland Russia Sweden 1 - 5 4 - 5 China Japan 1 -3 0.4 - 0.6 0.6 - 1 EU Korea Brazil 0.5 - 1 (BRA) Chile 4 - 5 New Zealand
Summary of Points • There’s plenty of supply just waiting for demand to kick in. • Plantations have expanded in regions outside of US. • Economics of getting the wood fiber to market will decide who gets to harvest their wood fiber. • US market will remain the strongest market globally.
Environmental Economics • Applying economic theory to environmental goods and services. • Includes the demand for environmental goods and services. • Includes the supply of environmental “bads” (Pollution and wastes).
Economics and The Environment Firms Input Output The Economy Households
Economics and The Environment The Environment Firms Input Output The Economy Households
Economics and The Environment The Environment Energy Firms Air Input Output The Economy Water Households Amenities Raw Materials
Economics and The Environment The Environment Pollution Energy Firms Air Input Output The Economy Water Households Amenities Wastes Raw Materials
Economics and The Environment: Strategies The Environment Conservation Pollution Energy Firms Air Input Output The Economy Water Households Amenities Wastes Recycle Substitutes Raw Materials
Economics and The Environment: Strategies The Environment Conservation Pollution Energy Firms Remediate Restore Remove Air Input Output The Economy Water Households Amenities Wastes Recycle Substitutes Raw Materials
Population With a larger population and increased technology, society has a greater impact on the environment.
The Sustainability Paradigm • Reviving growth. • Changing the quality of growth. • Meeting essential needs (jobs, food, energy, water and sanitation). • Conserving and enhancing the resource base • Reorienting technology. • Merging environment and economics in decision making.
The Key Issues • What is the correct level of environmental protection? • How should this be decided? • How should this level be achieved? • Who should bear the cost? • Requires an interdisciplinary approach • Economics, Ecology and Ethics
Economics and The Environment • Market failures and externalities • Cost of production are external to the price of the product • Lack of well-defined property rights • Internalizing environmental values
Decision Making • Cost benefit analysis • Project definition • Classification of impacts • Conversion into monetary terms • Discounting • Project assessment • Sensitivity analysis
A Cost Benefit Analysis of Forests and Fish Rules: A Case Study
Existing Buffers A sampled section with a single ownership and stream data.
Proposed Buffers A sampled section with a single ownership and stream data.
Net Buffers A sampled section with a single ownership and stream data.
Timber asset, road planning and lost wage costs range from 7.15 to 8.18 billion dollars
Fish Values As A Function of Incremental Project Success High Status Quo
Fish Values As A Function of Incremental Project Success Low Status Quo
Summary Points • Break even point suggests that probable benefits exceed probably costs for the 1st 5% increment in fish population • If the project produces an increase of less than 5% than the costs outweigh the benefits • The proposed rules are assumed to produce the first 5% increment over all other projects