Download
1 / 39
390 likes | 505 Views
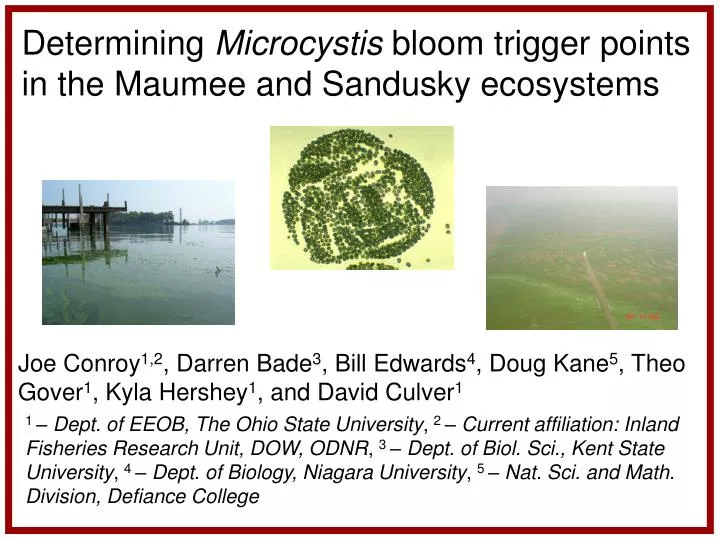
Determining Microcystis bloom trigger points in the Maumee and Sandusky ecosystems. Joe Conroy 1,2 , Darren Bade 3 , Bill Edwards 4 , Doug Kane 5 , Theo Gover 1 , Kyla Hershey 1 , and David Culver 1.

E N D
Determining Microcystis bloom trigger points in the Maumee and Sandusky ecosystems Joe Conroy1,2, Darren Bade3, Bill Edwards4, Doug Kane5, Theo Gover1, Kyla Hershey1, and David Culver1 1 –Dept. of EEOB, The Ohio State University, 2 – Current affiliation: Inland Fisheries Research Unit, DOW, ODNR, 3 – Dept. of Biol. Sci., Kent State University, 4 – Dept. of Biology, Niagara University, 5 – Nat. Sci. and Math. Division, Defiance College
Problem: Where & When do blooms start? Lake ? Bays ? Space Rivers ? ? ? Tribs Early spring Late summer Time
Roadmap • Part I: Determining bloom trigger points • Methods: measuring pools and process • Results: quantifying Microcystis abundance • Part II: Coupling social-ecological dynamics • Methods: modeling interactions • Results: interpreting complexity • Extensions: moving the problem upstream
Roadmap • Part I: Determining bloom trigger points • Methods: measuring pools and process • Results: quantifying Microcystis abundance • Part II: Coupling social-ecological dynamics • Methods: modeling interactions • Results: interpreting complexity • Extensions: moving the problem upstream
Field Sampling Methods: Data Collection
Laboratory Analysis Field Sampling Methods: Data Collection
Roadmap • Part I: Determining bloom trigger points • Methods: measuring pools and process • Results: quantifying Microcystis abundance • Part II: Coupling social-ecological dynamics • Methods: modeling interactions • Results: interpreting complexity • Extensions: moving the problem upstream
Roadmap • Part I: Determining bloom trigger points • Methods: measuring pools and process • Results: quantifying Microcystis abundance • Part II: Coupling social-ecological dynamics • Methods: modeling interactions • Results: interpreting complexity • Extensions: moving the problem upstream
Results: Microcystis trigger points • 1970 cyanobacterial biomass = 1 g m-3 • April tributary Microcystis biomass = 0.00–0.85 g m-3 • Only four samples without Microcystis!
Roadmap • Part I: Determining bloom trigger points • Methods: measuring pools and process • Results: quantifying Microcystis abundance • Part II: Coupling social-ecological dynamics • Methods: modeling interactions • Results: interpreting complexity • Extensions: moving the problem upstream
Roadmap • Part I: Determining bloom trigger points • Methods: measuring pools and process • Results: quantifying Microcystis abundance • Part II: Coupling social-ecological dynamics • Methods: modeling interactions • Results: interpreting complexity • Extensions: moving the problem upstream
Transient social-ecological stability: the effects of invasive species and ecosystem restoration on nutrient management compromise in Lake Erie 1 –Dept. of FABE, The Ohio State University, 2 – Current affiliation: Dept. of Oceanogr. & Coastal Sci., Louisiana State University, 3 – Dept. of Agr., Env., & Devel. Econ., The Ohio State University, 4 – Dept. of EEOB, The Ohio State University, 5 – Current affiliation: Inland Fisheries Research Unit, DOW, ODNR Eric Roy1,2, Jay Martin1, Elena Irwin3, Joe Conroy4,5, and David Culver4 Published in: Ecology & Society 15(1): article 20 2010. http://www.ecologyandsociety.org/vol15/iss1/art20/
Methods: Modeling interactions Ecological Model Social Model
Methods: Manipulations • Model calibrated & validated for Sandusky Bay • Few dreissenid mussels in Sandusky Bay • Large historical wetland at river-bay confluence 1. Simulated expansion of dreissenids into the bay • Consumptive effect ( phytoplankton, clarity = benefits) • Set MCF (Mussel Consumption Factor = 1.25) • Excretory effect ( PP, clarity = benefits) • Set MEF (Mussel Excretory Factor > 1.00) 2. Simulated wetland restoration • Mitigating effect ( P-load, PP, clarity = benefits) • Reduce P-load 12%
Roadmap • Part I: Determining bloom trigger points • Methods: measuring pools and process • Results: quantifying Microcystis abundance • Part II: Coupling social-ecological dynamics • Methods: modeling interactions • Results: interpreting complexity • Extensions: moving the problem upstream
Roadmap • Part I: Determining bloom trigger points • Methods: measuring pools and process • Results: quantifying Microcystis abundance • Part II: Coupling social-ecological dynamics • Methods: modeling interactions • Results: interpreting complexity • Extensions: moving the problem upstream
Results: Benefits through time • ML, Be, Bp • MEF, Benefits • Add wetlands, Benefits • Compromise reached over 50 y • Social-ecological feedbacks
Roadmap • Part I: Determining bloom trigger points • Methods: measuring pools and process • Results: quantifying Microcystis abundance • Part II: Coupling social-ecological dynamics • Methods: modeling interactions • Results: interpreting complexity • Extensions: moving the problem upstream
Roadmap • Part I: Determining bloom trigger points • Methods: measuring pools and process • Results: quantifying Microcystis abundance • Part II: Coupling social-ecological dynamics • Methods: modeling interactions • Results: interpreting complexity • Extensions: moving the problem upstream
Where & When do blooms start? • Microcystis present in 0.3-m deep, 1st-order streams • Biomass in main-stem rivers, bays, and the open lake • Microcystis occurs by late April (at least) • Microcystis abundant through October (at least) • Current Microcystis biomass = 1970’s Cyanobacteria
Where & When do blooms start? Lake ? Bays ? Space Rivers ? ? ? Tribs Early spring Late summer Time
Solving the Microcystis problem • People-ecosystem interactions important! • Interactions between user groups also important Ecological Model Social Model
Acknowledgements • Key personnel: • OSU: Amanda Martyn • KSU: Curtis Clevinger, Heather Kirkpatrick, Moumita Moitra • NU: Ashley Bantelman • Funding sources: • Ohio Lake Erie Protection Fund • Ohio Sea Grant College Program