Download
1 / 33
330 likes | 455 Views
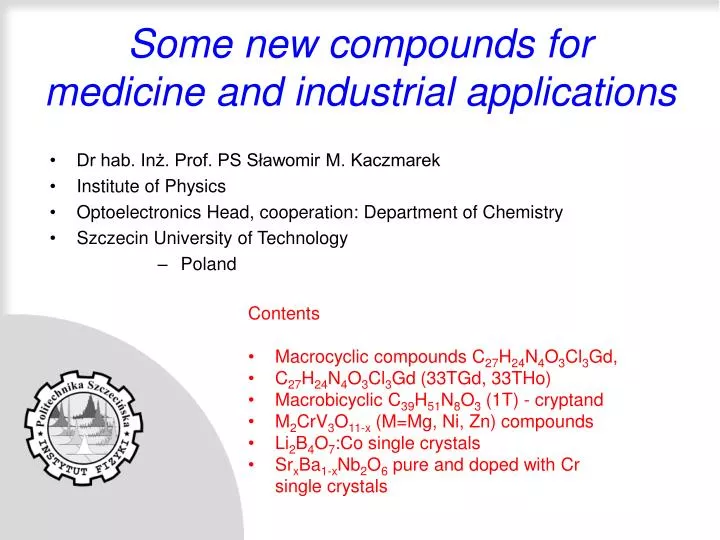
Some new compounds for medicine and industrial applications. Dr hab. Inż. Prof. PS Sławomir M. Kaczmarek Institute of Physics Optoelectronics Head , cooperation: Department of Chemistry Szczecin University of Technology Poland. Contents Macrocyclic compounds C 27 H 24 N 4 O 3 Cl 3 Gd ,

E N D
Some new compounds for medicine and industrial applications • Dr hab. Inż. Prof. PS Sławomir M. Kaczmarek • Institute of Physics • Optoelectronics Head, cooperation: Department of Chemistry • Szczecin University of Technology • Poland • Contents • Macrocyclic compounds C27H24N4O3Cl3Gd, • C27H24N4O3Cl3Gd (33TGd, 33THo) • Macrobicyclic C39H51N8O3 (1T) - cryptand • M2CrV3O11-x (M=Mg, Ni, Zn) compounds • Li2B4O7:Co single crystals • SrxBa1-xNb2O6 pure and doped with Cr • single crystals
1. Microcyclic compounds. MSc G. Leniec Taking into account their structure one canrecognize a lot of groups, e.g.: LigandComplex Podant Podate CoronantCoronate CryptantCryptate CarcerantCarcerate Among them macrocyclic and macrobicyclic compounds arises showing tendency to form complexes with cation of alkali-metals and rare-earths. The complexes are able to dissolve ionic compounds and inorganic salts in non-polar solvent. Synthesis of the compounds is very important in applied chemistry: separation of selected metals and supramolecular devices, fluorescent probes in biological systems, luminescence labels (detection of small amounts of biomolecules that can tell about the physical state of a patient) and medical diagnostics, treatment of arteriosclerosis, radioimmunology, as the contrast medium, as the synthetic enzyme to split chain of the nucleic acid [1, 2]. Gadolinium and other rare-earth elements are used as gasoline-cracking catalysts, polishing compounds, carbon arcs, and in the iron and steel industries to remove sulfur, carbon, and other electronegative elements from iron and steel. In nuclear research, the rare-earths are usually used in the form of oxides. An important application of gadolinium, because of its extremely large nuclear cross-section, is as an absorber of neutrons for regulating the control level and criticality of nuclear reactors. The nuclear poisons disintegrate as the reactivity of the reactor decrease, in the electronic and magnetic areas. One of the most important rare earths compound is gadolinium gallium garnet (GGG). GGG is used in bubble devices for memory storage [3]1. B. Dietrich, P.Viout, J.M. Lehn, Macrocyclic chemistry, Aspects of Organic and Inorganic Supramolecular Chemistry, VCH, Weihein, 1993 2. D. Parker, Macrocyclic synthesis, Oxford University Press, Oxford, 1996 3. M. Reza Ganjali et al, Analytica Chimica Acta 495 (2003),51-59, „Novel gadolinium poly(vinyl chloride) membrane sensor based on a new S-N Schiff’s base.”
33THo Holmium(III) Tripodal Tris(((5- chlorochlorosalicylidene)ethyl) amine Hot holmium (III) trifluoromethanesulfonate Ho(CF3SO3)3 was dissolved in the methanol CH3OH under the reflux condenser, after 10 minutes Tri-(2-aminoetylo)amine was added and kept hot for 5 minutes at ca. 500 oC. The mixture was cooled. The bright green-yellow product was filtered out, washed with the methanol CH3OH. The precipitate was dried over the silicagel. An example of the fluorescent probe S=1 and g=6.71.
Schiff basesare macrocyclic compounds with imina group. They are applied to cure leukemia, have antivirus activity (Oxphaman), show bactericidal, mycosicidals and nailicidal properties. On the other hand they are used as nonlinear optical materials (e.g. N-(R-salicylideno)-R’-anilin), as reversive optical storage, sunny filters, fotosta- bilizators, dyes for sunny collectors, molecular switches (due to photochromic proper- ties). They are used also in chemical analysis and synthesis (to fix of aminoacid composition, to detect of finger traces). H. Schiff, 1864 r. Oxphaman
Formation of macrocyclic complexes depends on the: • internal cavity, • rigidity of macrocycle, • nature of its donor atoms, • complexing properties of the counter ion • Synthesis of the macrocyclic compound is generally carried out in the presence of a suitable salt, the • cation of which is assumed to act as a template for the ring formation [4, 5]. • We synthesized and studied the magnetic research of the gadolinium cryptate (1TGd) • (macrobicyclic Schiff base) and the gadolinium podate (33TGd) (macrocyclic Schiff base) using • Gd(CF3SO3)3- trifluoromethanesulfonate. • The central metal ionsare coordinated by nitrogen atoms N, N1, N2, N3and the three oxygen atoms • O1, O2and O3. The coordination geometry aroundthe Gd atom is a monocapped distortedoctahedron. • C39H51N8O3 • 1TGd - Tris-(2-aminoethyl)amine (tren) (8 mmol) was added to a solution • of Gd(CF3SO3)3 (4 mmol) in hot methanol (70 cm3) and refluxed for 10 min. • Then 2-hydroxy-5-methylisophtalaldehyde (12 mmol) in methanol (30 cm3) • was added to this solution and refluxed for 2 min. A yellow solid was • precipitated upon cooling for 6 h. The crystalline powder was clarified by • filtration. Yield: 88%. Rigid. • Gadolinium Tris Tripodal Tris(((5-chlorochlorosalicylidene)ethyl)amine C27H24N4O3Cl3Gd • 33TGd - Tris-(2-aminoethyl)amine (tren) (8 mmol) was added to a solution • of Gd(CF3SO3)3 (4 mmol) in hot methanol (70 cm3) and refluxed for 10 min. • Then 5-chlorosalicylaldehyde (12 mmol) in methanol (30 cm3) was added to • this solution and refluxed for 2 min. A yellow solid was precipitated upon • cooling for 6 h. The crystalline powder was clarified by filtration. Yield: 76%. • Soft. • 4. D.E. Fenton, P.A. Vigato, Chem. Soc. Rev. 17 (1988) 69 • 5. V. Alexander, Chem. Rev. 95 (1995) 273
Gadolinium TripodalTris(((5-chlorochlorosalicylidene)ethyl)amine C27H24N4O3Cl3Gd [6] [6] Analytical Sciences, M. Kanesato, F.N. Ngassapa, T.Yokoyoma, „Crystal structure of …”,17 (2001) 1359 Gd–Gd ≈ 3,98Å Gd-O1 2.223 Å Gd-N 2.737 ÅGd-N1 2.542 ÅGd-N2 2.539 ÅGd-N3 2.529 Å Space group P21/c, Crystal system-monoclinic a = 10,042 Åb = 13,261 Åc = 21,635 Å b=101.990o D=1.688 g/cm3 Macrocyclic compound(podant) 33TGd Macrobicyclic compound(cryptant) 1TGd
TheElectron Paramagnetic Resonance (EPR) and magnetic research are a very useful technique for investigation of complexation of gadolinium complexes, although so far, there are not enough reports on EPR spectra of these complexes. Current interest in new gadolinium compounds derives from their potential applications as magnetic and/or optical probes. The ground state of the Gd3+ is 8S7/2, with a half-filled shell of seven unpaired electrons, the effect of the crystalline field is small, the zero field splittings are generally very small, and the long spin-lattice relaxation times usually allow the EPR spectra can be observed at room temperature. The EPR spectra of the studied complexes of gadolinium are similar to the EPR spectra of gadolinium in glasses. The characteristic feature is the presence of three lines at g=6, g=2.8 and g=2, assigned to the weak, intermediate and strong crystal field, respectively. The EPR spectra with three and more absorption signals were assigned to isolated Gd3+ ions. While the single broad absorption was assigned to the clusters of Gd3+ ions [7]. The Gd3+ has a 4f7 configuration and ground state 8S, that leads to a magnetic moment (independent of ligand fields effects) close to the spin only value ( meff=7.94mB per Gd3+). Infrared spectra of the 1T ligand show the absorption band at 1638.21 cm-1, which is characteristic of imine C = N bonds of the Schiff bases, and the absorption band at 3449.25 cm-1, which is characteristic of O-H bonds. Upon coordination to the metal ion the frequencies undergo a shift with a values of 12.28 cm-1 and 29.46 cm-1, respectively, what confirms complexation of the gadolinium cryptate 1TGd. The spin Hamiltonian for Gd3+ ion can be written as: H=HZeeman+HCF; (1) where g-value of the (S-state) ion is isotropic and equal to go as in the free ion. D and E are the zero field- splitting (ZFS) constants and HCF is the effective crystal field interaction term. In case of 1TGd we observed wide line appearing at g=2.03 in the superposition with two lines at g=1.63 and g=2.76, we observed also three additional lines at g equal to 3.80, 5.61 and 17.46, respectively. In case of 33TGd we observed three strong, superimposed lines with g value 1.86, 2.11 and 2.77 and two additional lines at 3.84 and 7.11. This indicate strong crystal field for two complexes of Gd3+ with S=7/2. It means that the Zeeman term is less than the crystal field term. [7] T. Ristoiu, E. Culea, I. Bratu, Materials Letters 41, 135-138, 1999
There is eight-fold spin degeneracy in Gd free ion. The strong crystal field split up the free ion level into four doubly degenerate energy levels. The Zeeman field removes such degeneracy. When transition of unpaired electrons occurs between these eight splitted levels, spectral peaks with different g value can be observed. Moreover, the g-value of each line does not depend on the temperature. The g-value was calculated from the following equation g=hn/mBBo, where h is the Planck constant, n is the microwave frequency, mB is the Bohr magneton and Bo is the value of the external applied magnetic field at the resonance line position. The Electron Paramagnetic Resonance measurements were performed with a conventional X-band Bruker ELEXSYS E500 CW-spectrometer operating at 9.5 GHz with 100 kHz magnetic field modulation. The samples contained ~30 mg of substance in the powder were placed into ~4 mm in the diameter quartz tubes. The first derivate of the power absorption has been recorded as a function of the applied magnetic field. Temperature dependence of the EPR spectra we received using an Oxford Instruments ESP helium-flow cryostat in 3 – 300 K temperature range. The susceptibility was measured on a SQUID magnetometer (MPMS-5 Quantum Design) in the magnetic filed up to 5 T in 2 – 300 K temperature range. Results The values of g -term were calculated from the fitting of EPR data to Lorentzian and Gaussian derivates functions performed for all the EPR lines of 1TGd and 33TGd complexes.
Week antiferromagnetic interaction of ion pairs with S=7/2. H = HZeeman = g0βB•S g=1.99 meff2=3Ck/mB2N c=C/(T-Q) 33TGd Magnetic momentum meff=8,46μB p=g[S(S+1)]1/2=7,94 μB
The differences in spectra observed between 1TGd and 33TGd are presumably due to different neighbourhood of the rare-earth ion. The molecule of macrobicyclic (1TGd) is much bigger then the macrocyclic one (33TGd). The gadolinium ion is placed inside the 1TGd complex and enough good isolated from another gadolinium ion. In this case the spin-spin interactions between ions are small and distances between them are much bigger, the consequences of that is the 1TGd spectra are better resolved then the 33TGd spectra. The peak-to-peak linewidth of 1TGd complex is not clear, but the linewidth of 33TGd complex does not change in the full temperature range. The structure with no water molecules in the inner sphere complexation of Gd3+ is characterized by one strong line of g=1.95-1.99 [8]. In proper fig. two lines were seen in a superposition at g=2.11 and g=1.86, what suggests appearing the water molecule in the inner sphere of the 33TGd complex. The susceptibility of magnetic ion follows the Curie-Weiss type behaviour for the 33TGd complex. The best fitting parameters are determined to be Q=-0.19 and C=0.013 . The effective magnetic moment per gadolinium ion is higher then the magnetic moment of the free gadolinium ion. This indicates some weak antiferromagnetic interaction of Gd ions and strong crystal field of ligands. Both the EPR measurement and magnetic susceptibility results agree well and show that Gd3+ ion is scarcely affected by the crystal field in this compound [9]. [8] A. Szyczewski, S. Lis, Z. Kruczynski, S. But, M. Elbanowski, J. Pietrzak, J. Alloys Comp. 275-277, 349-352, 1998 [9] G. Leniec, S.M. Kaczmarek, B. Kolodziej, E. Grech, to be published [10] G. Leniec, J. Typek, L. Wabia, B. Kołodziej, E. Grech, N. Guskos, „Electron paramagnetic resonance of Schiff base copper (II) complex, with poly(propylene imine)tetramine dendrimer (DAB – AM-8)”, Molecular Physics Reports, 39 (2004) 154-158 [11] G. Leniec, J. Typek, L. Wabia, B. Kołodziej, E. Grech, N. Guskos, „Electron paramagnetic resonance study of two copper (II) complexes od Schiff base derivatives of DAB AM-4”, Molecular Physics Reports, 39 (2004) 159-164
2. Synthesis and characterization of new compounds Ni2CrV3O11, Mg2CrV3O11 and Zn2CrV3O11MSc A. Worsztynowicz Transition metal oxides as well as their multicomponent systems have been objects of numerous investigations for many years, first of all because of their catalytic properties enabling their more and more comprehensive use in industrial practice as active and selective catalysts in many processes of oxidative dehydrogenation of lower alkanes [1].Literature information implies that there exists a series of compounds of a general formula M2FeV3O11 in the three-component metal oxide systems of MO – V2O5 – Fe2O3 type where M = Co, Mg, Ni, Zn [2, 3]. What is more, also compounds of M3Fe4(VO4)6 type are formed in some of these systems [4]. Compounds of Mg2CrV3O11 type being formed in the MO – V2O5 – Cr2O3 (M = Ni, Zn, Mg) systems have recently been obtained [5]. [1] E.Tempesti, A.Kaddouri and C.Mazzochia: Appl. Catal. A, Vol. 166 (1998) p. L 259 [2] I.Rychlowska-Himmel and A.Blonska-Tabero: J. Therm. Anal. Cal. Vol. 56 (1999) p. 205 [3] X.Wang, D.A.Vander Griend, Ch.L.Stern and K.R.Poeppelmeier: J. Alloys Comp., Vol. 298 (2000) 119 [4] M.Kurzawa and A.Blonska-Tabero: Mater. Res. Bull. (in press) [5] M.Kurzawa, I.Rychlowska–Himmel, A.Blonska–Tabero, M.Bosacka and G.Dabrowska: Solid State Phenom.
Compounds of M2CrV3O11 (M=Mg, Ni, Zn) were obtained for the first timeas a result of solid state reactions The reagents used for research were: V2O5, p. a. (Riedel-de Haën, Germany), Cr2O3,p. a. (Aldrich, Germany), 3 MgCO3·Mg(OH)2·3 H2O, p.a. (POCh, Gliwice, Poland),2 NiCO3·3 Ni(OH)2·4 H2O, p.a. (POCh, Gliwice, Poland), ZnO, p. a. (Ubichem, UK).The reacting substances were weighed in appropriate portions, thoroughly homogenised by grinding, formed into pellets and heated in cycles by means of a syllite furnace in theatmosphere of air. After each heating cycle the samples were gradually cooled down toambient temperature, ground and subjected to examinations by the XRD and DTAmethods; thereafter they were shaped into pellets again and heated, these proceduresbeing repeated until monophase preparations were obtained.
The DTA measurements were conducted by using the F.Paulik–L.Paulik–L.Erdey derivatograph (MOM, Budapest, Hungary). The measurements were performed in the atmosphere of air, in quartz crucibles, at a heating rate of 10/min in the range of 20-1000C. The mass of investigated samples amounted always to 500 mg. The XRD examination was always performed by using the diffractometer DRON-3 (Bourevestnik, Sankt Petersburg, Russia) and by applying the radiation CoK/Fe. The identification of the individual phases was based on the accordance of obtained diffraction patterns with the data contained in JC PDF cards [6]. The unit cell parameters of the obtained compound were calculated by means of the program POWDER [7], belonging to the crystallographic programs library of X-Ray System 70. Exact positions of diffraction lines were determined by the internal standard method. The internal standard used was ‑SiO2 (space group P3121, a = b = 0,49133(1) nm, c = 0,54044(3) nm). The density of the compound was measured by a method described in the work [8]. The IR spectrum was recorded in the wave-number range of 1100-250 cm-1 by means of the SPECORD M 80 (Carl Zeiss, Jena, Germany). A technique of pressing pellets with KBr at a weight ratio of 1 : 300 was applied. A sample of the new compound was examined using scanning electron microscope (JSM-1600, Joel, Japan) linked to an X-ray microanalyser (ISIS 300, Oxford). The electron paramagnetic resonance (EPR) spectra were recorded for both non-annealed in the air and annealed samples, using a Bruker E 500 X-band spectrometer. During the annealing the samples were held at the temperature of 750 K for two hours in oxidizing atmosphere. The temperature dependence of EPR spectra we registered in the temperature range of 4 to 300 K using Oxford helium gas flow cryostat. Magnetic measurements were carried out using a MPMS-5 SQUID magnetometer. Zero-field-cooled and field-cooled magnetization measurements were performed in the temperature range of 2-300 K at constant magnetic field. The isothermal magnetization was measured versus temperature and magnetic field up to 50 kOe. [6] Powder Diffraction File, International Center for Diffraction Data, Swarthmore (USA), File Nos.: 10-351, 34-13, 36-309, 4-829, 38-1479. [7] D.Taupin: J. Appl. Crystallogr. Vol. 6 (1973) p. 380 [8] Z.Kluz and I.Waclawska: Chem. Ann. Vol. 49 (1975) p. 839, in Polish
M2FeV3O11 (M= Zn, Mg) isostructural to M2CrV3O11 Composed of M(1)O6 i M(2)O6 octaheders, M(3)O5 i V(2)O5 trigonal bipiramidesand V (1)O4 tetraheders
The IR spectrum of Mg2CrV3O11. A:1100 and 830 cm-1 -stretching vibrations of the VO bonds in the VO4 tetrahedra and in the VO5 trigonal bipyramids, B: 830 – 650 cm-1 - stretching vibrations of the MO bonds in MO5 trigonal bipyramides and in MO6 octahedra, where M = Cr, Mg, Zn, NiC: 650 – 280 cm‑1 - bending vibrations of the VO bonds in the VO4 tetrahedra and of the MO bonds in the MO5 and MO6 polyhedra. It cannot be also ruled out that in this wave-number range the absorption bands could be ascribed to bending vibrations of MOV, CrOCr or to vibrations of a mixed nature. A C B SEM image of Mg2CrV3O11.The analysis of the biggest grains, performed by means of an X-Ray microanalyser, proved that the molar ratio of Mg : Cr : V corresponded to the stoichiometric value of 2 : 1 : 3. The IR spectra of Ni2CrV3O11 (curve a) and Zn2CrV3O11 (curve b).
Space group P1, triclinic • Mg2CrV3O11 is brown in colour and it melts at a temperature of 900 5ºC,Ni2CrV3O11 is dark brown in colour • and it melts congruently at a temperature of 940 5ºC,Zn2CrV3O11 is light brown, melts congruently at 680 • 5ºC. V - unit cell volume. EPR results • Two absorption lines with g2.0 (type I) and g1.98 (type II) we recorded in the EPR spectra, which can be • attributed to V4+ ions and Cr3+ ion clusters (pairs) respectively.Volumetric titration confirmed distinctly the • presence of vanadium V4+ ions in the investigated compounds. Studies of EPR spectrum in glasses [9] have • shown that EPR spectrum gradually changes with increase in the Cr2O3 concentration, • from an initial g≈4.0 low field absorption assigned to isolated, octahedrally coordinated • Cr3+ ions, to another one at high field with a g ≈2.0, attributed to exchange coupled pairs • of Cr3+ ions six-fold coordinated. They observed also Cr5+ absorption line in EPR spectra • with g=1.97. • [9] J. Ardelean, M. Peteanu, V. Simon, C. Bob, S. Filip, J. Mater. Sci., 33 (1998) 357
As the temperature increases, II (VO2+ centers) type line is not observed because is strongly overlapped by the broad and very intense I Type (Cr3+ clusters) Lorenzian line [10]. The I line could be clearly observed for higher temperatures, i.e. > 10 K, > 15 K, >70 K for (Zn, Mg, Ni)2CrV3O11-x, respectively. [10] A. Worsztynowicz, S.M. Kaczmarek, M. Kurzawa, M. Bosacka, " Magnetic study of Cr3+ ion in M2CrV3O11-x (M=Zn, Mg) compounds", J. Solid State Chem, 178 (2005) 2231-2236
In the same temperature range the peak-to-peak linewidth ∆Beff, increases substantially as the temperature is lowered (magnetically ordered state) while in high temperatures one can observe an interesting linear progress of the ∆Beff. At low temperature, where the exchange coupling interactions between Cr3+ ions became stronger, spin-spin relaxation time decreases with decrease in temperature and hence sudden increase in the linewidth is observed. Ni2+ ions (additional factor for Ni2CrV3O11) A week diamag. dimers Cr3+-O-Cr3+ V4+ [11] J.C.M. Henning, J.H. Den Boef, G.G.P. van Gorkom, Phys. Rev. B 7 (1973) 1825 [12] D.L. Huber, Phys. Rev. B 6 (1972) 3180
We suggest, that main contribution to total magnetic susceptibility arises from Cr3+ ion pairs with total spin S=2. At low temperature, as the interactions between chromium pairs become AFM and non-Curie susceptibility goes to zero, V4+ or other paramagnetic centers contribute to total magnetic susceptibility. Hence, a slight increase of -1 as T0 is predicted.
EPR and magnetic susceptibility on the recently synthesised vanadates M2CrV3O11-x (M = Zn, Mg) Provide experimental evidence that Cr 3+ ions in the compounds form clusters, may be pairs. The exchange constant, J, calculated by EPR measurements was: J/kB = -9.5 K and J/kB = -6.5 K for (Zn, Mg)2CrV3O11-x, respectively. The sign of J is negative and indicate antiferromagnetic interactions. Different lattice constants of Cr-Cr distance lengths between the compounds can cause different value of J constant. Accurate values of the Neel’s temperatures obtained from EPR data are: TN=3.1(9) K and TN=2.5(9) K for (Zn, Mg)2CrV3O11, respectively. Temperature dependence of the magnetic susceptibility shows also antiferromagnetic phase transition at TN=10 K and TN=11K for (Zn, Mg)2CrV3O11, respectively. The lack of decay of χ(T) is caused by the presence of V4+ ions or other additional paramagnetic defects. The existence of V4+ ions suggests that indeed strong oxygen-deficient can be present in M2CrV3O11-x (M = Zn, Mg) compounds.
Fig. 1. Structure of LBO crystal along c-axis ( - B, - O, - Li ) 3. Growth and optical properties of Li2B4O7 pure and Co doped single crystalsMSc Danuta Piwowarska [1] Li2B4O7 (LBO) crystal is a negative uniaxial crystal, which belongs to the 4 mm point group and I41cd. (C124v) space group of tetragonal symmetry (a=b=9.479 Å, c=10.286 Å). Its structure is determined by the B4O9 net, the Li+ ions are localized in the special spaces in this net. B-O mean distance is equal to 1.45 Å, O-O to 2.38 Å, and Li-O to 2.1 Å. The structure of the crystal along c axis is presented in Fig. 1. LBO melts congruently at 1190 K at a composition of 1:2 of Li2O and B2O3, so it may be grown by Czochralski and Bridgmanmethods. Rare-earth and transition metal ions may substitute for both octahedral Li+ and tetrahedral B3+ sites. It is expected that primarily the Li site should be occupied by all the dopant ions due to extremely small size of boron ion (0.23 Å). [1] D. Piwowarska, S.M. Kaczmarek, W. drozdowski, M. Berkowski, A. Worsztynowicz, „Growth and optical properties of…”, Acta Phys. Pol. A, 107 (2005) 507-516
LBO is a piezoelectric material and has been studied as a substrate for surface acoustic wave (SAW) devices Microwave devices using surface acoustic waves are in common use for infrared filters for color television and under signal processing elements • LBO have been also studied as promissing non-linear crystal • Nonlinear optical properties of LBO in the UV range were demonstrated and commented on the fourth and fifth harmonic generation of a YAG: Nd laser • LBO is considered to be one of the useful materials for neutron detection because it contains Li and B, which possess large neutron capture cross-section isotopes Li2B4O7Single crystals obtained by Czochralski method in the Institute of Physics, SzczecinUniversity of Technology a) pure LBO single crystal b) LBO:Co (0.5 mol. %) single crystal [2] R. Komatsu, T. Suagawara, K. Sassa, N. Sarukura, Z. Liu, S. Izumida, Y. Segawa, S. Uda, T. Fukuda and K. Yamanouchi, Appl. Phys. Lett., 70 (1997) 3492 [3] Ya.V. Burak, B.V. Padlyak, V.M. Shevel, NIMB 191 (2002) 633
Czochralski puller In the Optoelectronics Head, Institute of Physics, Szczecin University of Technology
Co doped Li2B4O7 (1 mol. %) crystal 11:29.24 Czochralski growth. Date: 21/06/2004 11:29.24 Material: LBO:Co1% starting weight 151.00 g 11:29.24 Crucible: TPt50 11:29.24 Density 1.95 g/ccm 11:29.24 Expected parameters of the crystal: 11:29.24 ************ Seed Cone Cylinder 11:29.24 Diameter [mm] 5.5 ----- 20.0 11:29.24 Length [mm] 10.0 13.6 100.0 11:29.24 Weight [g] 0.5 3.9 61.3 11:29.24 Time [h] 16.7 29.1 166.7 11:29.24 Cone gape [deg]: 80.0 11:29.24 Crystallization front gape [deg]: 140.0 11:29.24 constant growth rate in the middle of the crystal 11:29.24 as high as 0.60 mm/h Dielectrical permissivity Dielectrical losses Conductivity
The melt was prepared by melting in platinum crucible at first B2O3 of 4N purity and gradually adding Li2CO3 of 5N purity to reach starting composition with 67.9 mol.% of B2O3. Growth rate 0.6 mm/h, rotation rate 6 obr/min, time of the pulling – 44h
b) a) type no E (eV) ln (s) 1 3.903e+04 3.183e-02 3.436e-01 2 2.710e+04 7.226e-02 2.828e+00 3 4.969e+04 8.967e-02 7.465e-01 T=12K, B||[001] A||[110], C||[001]
WAŻNIEJSZE WYNIKI I ICH INTERPRETACJA- EPR Experimental anisotropy, XY plane (AB); (T=4K, υ=9.45622÷9.46365 GHz) Experimental anisotrophy, XZ plane (AC); (T=4K, υ=9.45811÷9.46137 GHz) • Experimental anisotrophy – two structural nonequivalent paramagnetic centers of Co2+ ions (α, β) • Spin Hamiltonian: Experimental anisotrophy, ZX plane (BC) (T=4K, υ=9.45647÷9.46008 GHz)
Second-harmonic generation
4. Growth of strontium barium niobate: doping with chromium Students Due to its outstanding photorefractive, electrooptic, nonlinear optic and dielectric properties SrxBa1-xNb2O6 is one of the most interesting materials. Potential applications include pyroelectric detection, holographic data storage, surface acoustic wave devices, phase conjugation, quasi-phase-matched second-harmonic generation and electro-optic modulation. SBN crystallize in a tetragonal tungsten bronze structure over a wide solid solution range. All physical properties of SBN are composition dependent (x=0.5-0.61). [4] M.Ulex, R. Pankrath, K. Betzler, J. Cryst. Growth 271(2004) 128-133 Pure SBN crystal obtained in the Institute of Physics Szczecin University of Technology
Pure SBN crystal 1:58.10 Czochralski growth. Date: 6/06/2005 11:58.10 Material: Sr0.5Ba0.5Nb2O6 starting weight 178.00 g 11:58.11 Crucible: TIr40 11:58.11 Density: 4.40 g/ccm 11:58.11 Expected parameters of the crystal: 11:58.11 ************ Seed Cone Cylinder 11:58.11 Diameter [mm] 5.5 ----- 20.0 11:58.11 Length [mm] 10.0 13.6 100.0 11:58.11 Weight [g] 1.0 8.9 138.2 11:58.11 Time [h] 3.3 6.0 33.3 11:58.11 Cone gape [deg]: 80.0 11:58.11 Crystallization front gape [deg]: 140.0 11:58.11 constant crystal growth in the middle of the crystal 11:58.11 as high as 3.00 mm/h SBN crystal doped with Cr 10:50.15 Czochralski growth. Data: 7/07/2005 10:50.15 Material: SBN:Cr0.02% starting weight 175.00 g 10:50.15 Crucible: TIr40 10:50.15 Density: 4.40 g/ccm 10:50.15 Expected parameters of the crystal:: 10:50.15 ************ Seed Cone Cylinder 10:50.15 Diameter [mm] 5.5 ----- 20.0 10:50.15 Length [mm] 10.0 13.6 100.0 10:50.15 Weight [g] 1.0 8.9 138.2 10:50.15 Time [h] 4.0 7.2 40.0 10:50.15 Cone gape [deg]: 80.0 10:50.15 Crystallization front gape [deg]: 140.0 10:50.15 constant crystal growth in the middle of the crystal 10:50.16 as high as 2.50 mm/h