Download
1 / 26
260 likes | 356 Views
Opportunities for Achieving Significant Energy Reduction in Existing University Buildings: Developing efficient HVAC operations . Michael Gevelber, Robert Choate, Kevin Sheehan, Thomas Vitolo , Elijah Ercolino , Leah Ricci, Liz Lacy, Matt McHale, et. a l. Outline Overview of BU energy use

E N D
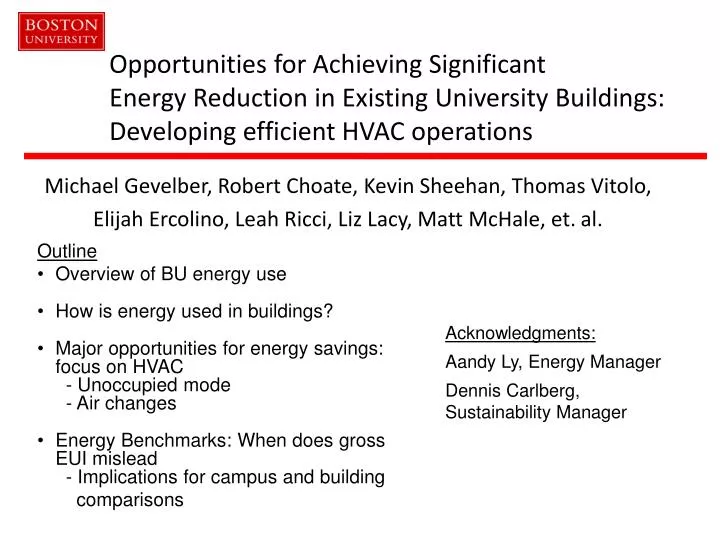
Opportunities for Achieving SignificantEnergy Reduction in Existing University Buildings:Developing efficient HVAC operations Michael Gevelber, Robert Choate, Kevin Sheehan, Thomas Vitolo, Elijah Ercolino, Leah Ricci, Liz Lacy, Matt McHale, et. al. Outline • Overview of BU energy use • How is energy used in buildings? • Major opportunities for energy savings: focus on HVAC - Unoccupied mode - Air changes • Energy Benchmarks: When does gross EUI mislead - Implications for campus and building comparisons Acknowledgments: AandyLy, Energy Manager Dennis Carlberg, Sustainability Manager
2009 2008 2010 Summary of Findings from GE 520/MN 500: “Energy Audit/Conservation Analysis of BU’s Charles River Campus” Michael Gevelber, Associate Professor Mechanical Engineering, Co-chair BU Energy Working Group, Member of BU Sustainability Comm, & Clean Energy and Environmental Sustainability Initiative (CEESI)
Results of 2007 Energy Audit Total Energy Use Energy Intensity (Per Sq Foot) 18% Increase in Energy Intensity 68% Growth in Energy Use Natural gas Electricity • What are the reasons for these trends? • What can be done to reverse these trends? Light oil Cleveland, C. (2007, Oct 24). Energy and Emissions Footprint: Boston University Charles River Campus. Presentation to the BU Energy Club. Heavy oil
Extended Team Don DeRosa, Asst. Prof., SED Doug Zook, Assoc. Prof., SED SED Green Committee Larry Valles, Lab Manager, Biology Colleen McGinty, Director Construction Shaun Finn, LEED Certified AP Eric Gauthier, IT • William Steward, IT • Chuck Von Lichtenberg, IT • Building Managers: • Carlos Vazquez • Tyrone Lawless • Roger Seale • Dennis Batista • Fernando Sousa • Outside Experts: • Domenic Armano, Manager, Johnson Controls • Ray Thompson, Sales Manager, Andover • Peter Harris, Director Operations, B&V Testing • Stephen Drummey, Drummey Mechanical Michael Field, Former Asst. Provost Gary Nicksa, VP Operations Tom Daley, Assoc. VP Facilities Bill Walter, Asst. VP Facilities Domenic D’Alleva, HVAC Tim O’Connor, Electrical Tom Parker, Automation Paul Arsenault, HVAC Mark Harney, Asst. VP Facilities Aandy Ly, Asst. Dir., Energy ZhonghongPeng, Assoc. Dir. Paul Rinaldi, Space Management Karen Zaharee, Analyst Mike Penn, OEHS
Building Energy Use by FuelCharles River Campus 2005-2007 Energy Supply 106 kBtu Energy Expenses/GHG
BU Energy Use Index: kbtu/ft2, by building type LSEB (468) Photonics (336) SMG (220) 140 BSR (140) - Focus on high energy density buildings NOTES: (1) BUMC Net Area does not include NEIDL and rental properties (2) Data sources from BU energy audit class (M. Gevelber) & Facilities (P. Zhong & A. Ly)
Seven Building Analysis-Sargent -SMG -15 St Mary’s -PRB -44 Cummington -LSEB -Photonics
Energy Cost Density by Building • What drives energy performance? • What are opportunities for improvement?
HVAC Cost and Energy Implications • HVAC accounts for 60-70% -of energy use and 50-65% of energy cost in a building.
How does a Building HVAC system work? • How much energy can be saved in a building? • Currently energy enriched air is being exhausted around the clock—not based on occupancy • How can energy use be decreased without affecting comfort? • Setback/Increase of temperature in winter/summer • Dehumidify only when necessary • Reduce exhaust of conditioned air during low occupancy Outdoor Air Temp: 30 Degrees Damper Intake Exhaust Air Dampers AHU Heating And/Or Cooling Return Air Building: 70 Degrees 40,000 CF Building Circulation
Building Energy Use Average Daily Temp. 2007 • Cooling season: May-Late August • Cool to 55, then heat to 70 • Heating season: Sept – Mid April • Energy Use Determined By: • Outdoor Conditions • Temperature • Humidity • Indoor Air temp Settings • Percent of outside air needed for air quality Indoor Temperature Outdoor Temperature Heating Cooling
$/CFM by Building Fans Cooling Winter Heating Summer Reheat Average $/CFM Breakdown • $3-5/CFM • => Reduce CFM Cooling Winter Heating Building Reheat Fans Average 24% 14% 19% 43%
Set Back Analysis15 St Mary’s St. First Case Study50,000 sqftoffice/class building
Should change start up to avoid spike User Demand Weekend Minimal Fan/AC Why so high? Analysis of Summer Results (15 St Mary’s) Before Unocc. With Unocc. Weekday • Profound drop in demand (38%) during Unocc period • 11 hour unoccupied • Some implementation issues observed Weekday User Demand ~40 kWh Weekend Unocc. Mode Savings 2009 Unocc. mode
Original Estimate Updated • Reduce Nighttime Exhaust (8 hrs) • Find energy used to condition a unit volume of air • Find volume of air exhausted • Add energy used to condition air across all units of air exhausted • Estimated Savings • 11% of total oil ($7,400) • 7% of total electric. ($10,900) • Estimated Implementation Cost • $17,500—about 1 year payback • $17.5k to Andover • The rest is Rebalance! Was it needed? Estimate of Potential Setback Savings Cooling electricity savings Heating oil savings $12,522 21% 13% ~$20k $50k <2
Implementation Lessons Room Temp • Need to spec out more thorough implementation • OA Damper Stuck open • Winter AHU heating level 100% • Spike when heat comes on • Utility and AHU level analysis: check to see what’s really happening. Need to coordinate between HVAC staff, automation, and energy. • What was really necessary • Rebalancing? Setpoint
Energy Savings: Solving for the Hidden Costs of HVAC Achieving Energy Efficiency in Existing Commercial Buildings Our Focus: HVAC is50-70% of ALL energy used in mid/large size buildings Strategy: Reduce high air flow rates which were implemented when energy was cheap. • Our Solution • Develop new tool to re-optimize HVAC control • This is not addressed by current tools • Based on real buildings, experience and data Professor Gevelber & Professor Wroblenski BU Mechanical Engineering Funded by MA Clean Energy Center
Basis for Opportunity/Value ACH Overall Building ACH vs. Energy $/sq.ft. Office/Class Lab Lab Office/Class Target Vent for 100%Lab Target Req. for Ventilation Many buildings designed when energy was cheap so used high air flow to assure ventilation, humidity, and thermal needs were met. For existing buildings, hard to know “how low you can go” Should base design on minimum air flow for ventilation & lab safety Our system provides easy basis to re-optimize
Our Core Concept Chiller Room-by-room experiments run through existing BAS VAV Box Determine actual ACH for each room (No plans needed) Establish minimum ventilation needs Reset ACH through existing BAS software Enables monitoring/ diagnostics & commissioning Aggregation enables building-level optimization Building HVAC Schematic Control Air handling unit
Which EUI should we use for analysis? • Energy Stars (based con CBECS data), and AASHE Stars program are based on gross square feet • Does using gross area hide or distort both campus and building energy efficiencies? • Key issues: • buildings with larger parking lots & • large interior spaces that are not conditioned
EUI Case Study: Medical Campus • 19 buildings including 2 parking garages • Downtown Campus: Parking is 40% of Gross Area. Net is 71% of gross (but incl. parking since assignable) . • How does considering net & parking affect EUI Analysis (kbtu/sqft)?
Analysis of Medical Campus EUI What are the effects of parking? • Using Gross EUI, including parking, hides major energy use! • 212% difference between net w/o Parking and Gross EUI • Why does this happen? parking uses 10-20 kbtu/ft^2, BUT need to consider net area includes parking since assignable! *EUI = Energy Use Intensity in kBtu/sq. ft
Analysis of BU Charles River Campus • 280 Buildings • Gross Area: 11,690,000 sq. ft. • Net Area: 9,362,500 sq. ft. • (80% of gross) • Building Parking: 701,400 ft2, 6% of area
Analysis of BU Charles River Campus • While parking is only 6% area, its EUI is so low (10-20 kBtu/sq. ft) that it distorts EUI calculation • 25% difference in EUI net to gross, but • 35% difference in EUI for net and gross • area w/o parking
Analysis of Individual BuildingsGross & Net Areas w/ Parking • For individual buildings, taking account of net area & parking yields significantly different results ( 68%-95%). • Important for obtaining good building priority list
Summary • What is the EUI of different buildings, org. by types: provides roadmap • Consider net area and w/o parking • HVAC should be a major area of focus: 70% of energy • require better coordination amongst facility groups, some special experts and manpower, , but offer substantial cost reduction and green benefits • Implementing unoccupied modes • Low cost: <1 yr payback & 10-15% Energy savings • Deeper savings: focus on ACH • Energy cost ACH….and we are over-ventilating our buildings • Mostly reprogramming, but rebalancing possibly required.