Download
1 / 15
150 likes | 233 Views
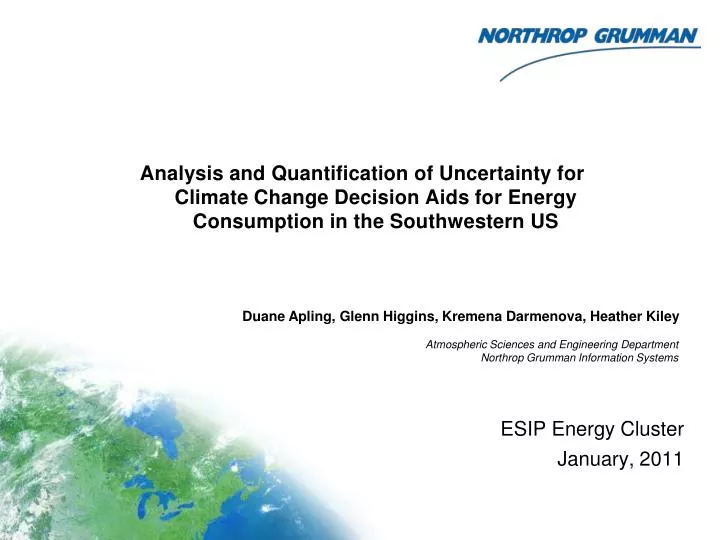
Duane Apling, Glenn Higgins, Kremena Darmenova, Heather Kiley Atmospheric Sciences and Engineering Department Northrop Grumman Information Systems. ESIP Energy Cluster January, 2011.

E N D
Duane Apling, Glenn Higgins, Kremena Darmenova, Heather Kiley Atmospheric Sciences and Engineering DepartmentNorthrop Grumman Information Systems ESIP Energy Cluster January, 2011 Analysis and Quantification of Uncertainty for Climate Change Decision Aids for Energy Consumption in the Southwestern US
CKIC - Climate Knowledge Integration Centers A Northrop Grumman Climate Initiative Effort Mission Specific Data System development feedback User Engineering User Requirements User experience Global Climate Models/ Observations: CCSM3 & ECHAM5, NCEP Reanalysis User Display Customer GUI • Initial and Boundary Conditions User Needs Driven Decision Support System • Service requests • Actionable information WRF - Regional Downscaling for Southwestern US Decision Support System Product Generation & Visualization Tools User specific engineering output with uncertainty and risk assessment • Ten-year historical reanalysis • Reference free runs • Model validation • Future period runs (12 /4 km res) HDD/CDD Analysis per User Specified Bounds • Composite temperature • dataset w/ means and • variances • CDD/HDD Application Data Records Model Data Records Uncertainty Quantification Database Management with unified access services CKIC: A systematic framework for producing Actionable Decision Aids, such as Uncertainty Characterized Energy Consumption Scenarios
Energy Consumption Modeling Strategy Providing end-users with actionable climate-model based Decision Aids • Problems: • Available IPCC models operate at coarse spatial and temporal resolution • Climate change signatures are bound up with various modeling system biases • Need to characterize Uncertainty objectively to bound utility of results • Energy consumption data has operational “flavor” – many non-environmental factors • Solutions: • Downscale IPCC runs using well-regarded regional model – WRF in “Climate Mode” • Perform systematic objective bias correction • Adjust historical reference runs to match high-quality climatologies • Correct model scenario runs for local/time-of-day/seasonal biases in first and second order statistics • Bound intrinsic modeling uncertainties using statistical analysis of multiple periods • Limited scope of project dictated two, ten year periods of record • Produce standard error estimates for all derived decision aids using well-known statistical methodologies • Acquire energy consumption data from actual operational facilities • Provided by facilities managers from Fort Carson, Colorado; and Peterson Air Force Base, Colorado (These potential end-users were briefed on project results in September, 2010) • Perform regression modeling for energy use • Outlier detection • Error parameterization and propagation
Modeling Overview Regional Downscaling as a route to Decision Aids Model Initialization Historical Reference Run Current Control Period Free Run Future Period Free Run (2001-2009) ECHAM5 IPCC 21stcentury run1 1.9x1.9 deg (2030-2039) ECHAM5 IPCC A1B scenario 1.9x1.9 deg (2000-2009) NCEP Reanalysis 2.5x2.5 deg Dynamical Downscaling WRF 3.1.1 "Climate mode" Variable CO2, Deep Soil Updates Grid Nudging, SST/Skin Temperature Model Validation Historical Energy Usage Data Quantitative Climate Decision Aids Global Historical Climatology Network (GHCN) Heating and Cooling Degree-Days Fort Carson Peterson AFB WRF output Hourly at 12 km Intercomparison and Bias Correction OSU PRISM Gridded Observational Dataset Historical Reference Run Current Period Free Run Future Period Free Run Empirical Energy Consumption Models
PRISM Bias Correction Improving Reference Run Accuracy NCEP/WRF Historical Reference Run Correction to Temperature Relative to PRISM PRISM Correction Stage • PRISM Dataset defines Daily High/Low statistics • NCEP Control run linearly transformed by hour to match equivalent monthly statistics of average highs and lows • Water bodies and urban land-use cells corrected in local neighborhood Notables • Daily range tends to be increased • Reservoirs in Eastern New Mexico show out as warm cells • PRISM data extent does not cover oceans or outside of CONUS US Jan 2000-2009 Jan 2000-2009 PRISM: “Parameter-elevation Regressions on Independent Slopes Model” The PRISM Climate Group at Oregon State University
Bias Correction to Reference Run Producing Intercomparable Model Datasets ECHAM/WRF Control Run Correction to Temperature From NCEP/WRF Reference Run Bias Correction Stage • Reference Run Dataset defines Monthly/Hourly expectations and variances as well as temporal autocorrelations – corrected to match PRISM climatology • Analysis of NCEP Control Run defines Autoregressive time series transform which removes Monthly/Hourly deviations in first and second order statistics from Reference Run • Transform applied to both Control and Future period model runs to establish inter-comparability with Reference Run Notables • Daily range tends to be increased in all months • Reservoirs in Eastern New Mexico show out as warm cells in the minimums • WRF modeled Urban Heat Islands preserved • PRISM data extent does not cover oceans or outside of CONUS US Jan 2000-2009 Jan 2000-2009
Climate Change Signature A1B Regional Climate Change ECHAM5/WRF Future Period – Current Period IPCC A1B Scenario over 30 Years • 2000-2009 compared to 2030-2039 • Bias corrected to NCEP/WRF-PRISM historical reference sets • Simultaneous computation of standard error bounds individually by cell Notables • Overall increase in temperature of 1 to 2 degrees • Winter temperatures slightly cooler in the high plains of Colorado • Snowpack differentials between the time periods amplify local temperature signatures Jan 2030’s – 2000’s Jul 2030’s – 2000’s
Degree-Days Quantitative Climate Decision Aid for Energy Consumption Computed 65F Baseline HDDs with Standard Error Estimates Jan ECHAM/WRF 2000-2009 HDD Jan ECHAM/WRF Future – Current HDD
Energy Model Structure Energy Use expressed as a function of Heating and Cooling Degree-Days • Real world data from Peterson AFB and Ft Carson showed: • Long-period trends driven by outside factors • Electrical use trends confounded by these factors • Natural Gas usage at both locations seasonally dominated • Electrical use having both summer and winter maxima • Significant outliers in both datasets • Energy use per square foot was modeled as a factored linear sum of: • Linear Time Trend & Sinusoidals with 10, 5, and 3.3 Year periods • Heating Degree Days computed from 55, 65, and 75 deg F bases • Cooling Degree Days computed from 55, 65, and 75 deg F bases • "Winsor" style window padding at 5% weight level for one year prior and post series. • Automated outlier detection • Classic Linear Regression analysis yielding: • Weight factor parameter estimates • Parameter error covariance matrix • R2 Goodness of fit • Residuals for post facto model assessment
Uncertainty Management Uncertainty Quantification expressed as an End-to-End System Some Climate Modelling Uncertainty Sources Schema Ensembles and Statistical Bias Correction Longer Period Runs and Perturbation Ensembles Time-Series and Extreme Events Analysis Limited Realizations Lengths of Runs Insufficient to Exactly Characterize Model Outcomes Inter-Annual Variability Natural Long-Period cycles in Weather Confound Specification of Climatological Statistics Inaccuracy Model Fails to Represent Totality of the Earth System Uncertainty Reduction and Characterization U-R&C Reduction: Establish Historical Reference Run Apply Best Trusted Climatology (PRISM) Perform Statistical Bias Corrections Characterization: Assess Distributional Forms Identify UMVUEs of expectations and standard errors of fitted parameters Current Free Run Future Free Run Scenario Change Analysis Empirical Modelling Uncertainty Sources Historical Reference Run Inadequate Physical Understanding Apply Regression to Current Period Energy Use Change and Confidence Bounds Regression System Formulation and Solver Regression Parameters and Errors Model Structure and Form Apply Regression to Future Period Imprecise, Inaccurate, Corrupted Data Exploratory Identification of Regression Predictors Outlier Detection by Cross-Correlations Window Padding to minimize boundary effects Robust SVD Numerical Solver Parameter Uncertainty Estimation for Goodness of Fit Composited Uncertainty from Downscaling, Regression Fitting, Inter-period Differencing
Fort Carson Data Fort Carson hosts 30,000 personnel, with over 10,000 residing on-post • Square Footage for Fort Carson was very-roughly estimated to range from 6 Million square feet in 1999 to 9 Million in 2010 • Trends in energy use are shown along with the model's fit and the actual data being fit to • Fort Carson is well behaved. Unexpectedly, electrical use has a significant double maximum; in both summer and winter – implying electrical power is used for heating or other winter-time seasonal activities as well as cooling • Many outliers were detected in gas usage, but few were significant with outlier probability very near 1.0 Results here must be treated as notional pending full and accurate specification of building square-footage for both locations. This important variable was fabricated as a placeholder for Fort Carson
Peterson AFB Data Peterson Air Force Base hosts over 7400 personnel, largely residing off-base • Square Footage for Peterson AFB was provided for three fiscal years, and interpolated/extrapolated to the full period • Trends in energy use are shown along with the model's fit and the actual data being fit to • Note the significant outliers in both electrical and natural gas use. Outlier deweighting minimizes the effect of these on the models, but at a slight adverse technical effect on the total model fit Results here must be treated as notional pending full and accurate specification of building square-footage for both locations. This variable was interpolated from three year’s actual data to the full period for Peterson AFB
Energy Consumption Scenarios Natural Gas consumption likely to decrease, Electrical consumption more mixed Peterson AFB Fort Carson ECHAM/WRF Climate Downscale shows a later onset of winter, with the peak inter-period change being in October Gas usage in both bases is consistent; error propagation shows a significant annual decrease in use as the climate warms and reduces need for heating fuel Electrical usage is much more mixed, with a modest increase in power usage for cooling in the warmer summertime maximum
Future Directions CKIC Project continuing to advance Science and Technologies supporting Actionable Decision Aids CKIC • New techniques and data in uncertainty reduction and characterization • Local conventional reports driven bias correction • Develop new visualizations and user-oriented uncertainty presentation products • Multiple Models – ORNL’s CCS3/WRF Downscales • Fold into U-R&C process • Establish lower bounds on inter-model sources of uncertainty • Additional Schema and Perturbation Ensembles • Better characterization of intra-model spreads of outcomes • Narrow ranges of standard errors on derived products • Provide better capability to represent and characterize extreme events • Explore New Application Areas Energy Water CCSM3/WRF Downscales Public Health Perturbation Ensembles Agriculture Schema Ensembles Variational model configurations Deep soil T update Grid nudging SST update diurnal variation of the skin SST; dynamic subskin SST variation allow for a seasonal variation in the deep-layer soil temperature keep the modelled fields close to the input data