Download
1 / 8
90 likes | 258 Views
Learning to Swim : The transition from data desert to deluge in undergraduate biology education. Overview of Session.

E N D
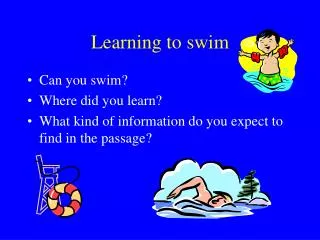
Learning to Swim: The transition from data desert to deluge in undergraduate biology education
Overview of Session A series of short activities and presentations to get you thinking about what it means to have scientific data literacy and how we might design learning environments that support the development of scientific data literacy. Use the following questions to reflect on this session: • What did I need to know and be able to do (knowledge and skills) to work successfully with this data? • How accessible was the data (conceptually, technically)? • In what ways did this data reflect features of its scientific origins and use?
Activity 1- Exploring Ecoregion Biodiversity with Science Pipes
Activity 1- Exploring Ecoregion Biodiversity with Science Pipes See the online workshop schedule for links http://bioquest.org/scaleit2012/schedule/ Time: 15 minutes Task: Work in pairs to get oriented and explore the “pipe” interface then ask you own question. Reporting: Post a comment with a description of what your question was and what you found – include a link to the graph. (share – link to this result)
Activity 2 – Working with the WildFinder Data at WWF See the online workshop schedule for links http://bioquest.org/scaleit2012/schedule/ Time: 15 minutes Task: Work in pairs to get oriented and explore the WildFinder web interface and excel data sheet then ask you own question. Reporting: Take a few notes and be ready to share what you were working on and what you found with the large group.
Discussion • What did you need to know and be able to do (knowledge and skills) to work successfully with this data? • How accessible was the data (conceptually, technically)? • In what ways did this data reflect features of its scientific origins and use?
Resources Science Pipes Home Pagehttp://sciencepipes.org/ World Wildllife Fundhttp://www.worldwildlife.org/ WildFinderhttp://www.worldwildlife.org/science/wildfinder/ WildFinder Datahttp://www.worldwildlife.org/science/data/item1872.html