Download
1 / 43
430 likes | 644 Views
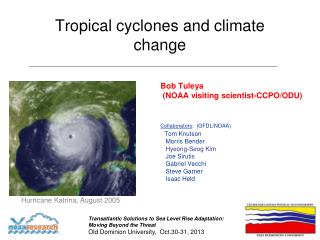
Tropical and extra-tropical cyclones in high resolution climate predictions. Professor Lennart Bengtsson Max Planck Institute for Meteorology, Hamburg ESSC, University of Reading ISSI, Bern. Tropical and extra-tropical cyclones in high resolution climate predictions. Background

E N D
Tropical and extra-tropical cyclones in high resolution climate predictions. Professor Lennart Bengtsson Max Planck Institute for Meteorology, Hamburg ESSC, University of Reading ISSI, Bern Workshop on "High-Resolution Climate Modeling" Lennart Bengtsson
Tropical and extra-tropical cyclones in high resolution climate predictions. • Background • The successive improvements in NWP during the last two decades are to a considerable degree related to the improvements in the prediction of extra-tropical cyclones and the interactions with the large scale flow. Numerical experiments demonstrated that improved horizontal resolution played a decisive role. • Prediction of tropical cyclones with comprehensive global models has been less impressive but during the last 5-10 years most tropical cyclones are predicted some days in advance although the intensity is generally significantly underestimated. • My view for a long time has been that the dynamics and physics of both extra-tropical and tropical cyclones are comparatively simple and can be well reproduced by parameterization schemes presently ised in GCM. Failure to do so is most likely due to aliasing caused by insufficient resolution. Workshop on "High-Resolution Climate Modeling" Lennart Bengtsson
Tropical and extra-tropical cyclones in high resolution climate predictions. • The present study consist of a series of climate modeling experiments using high resolution versions of the ECHAM5 atmospheric model run at T213 and T319 resolution. The ocean boundary conditions have been obtained from a coupled climate run by the ECHAM5/OM at T63 resolution. • We have calculated results from the 20th century 1960-1989 ( using observed GHG) and for 2070-2099 ( using scenario A1B) • Tropical and extra-tropical cyclones have been evaluated both in an Eulerian and Lagrangean representation) Workshop on "High-Resolution Climate Modeling" Lennart Bengtsson
Selection of storm tracks from sequences of maps using vorticity at 850 hPa as a tracerMany thanks to Kevin Hodges • Level 850 hPa • Lifetime ≥ 48 hours • Intensity in vorticity ≥10-5s-1 • Movements ≥1000km • We identify all transient extra-tropical storms during 32 years from sequencial 6 hr fields. We focus her mainly on the winter season (DJF) Workshop on "High-Resolution Climate Modeling" Lennart Bengtsson
Extra-tropical cyclone from Nov.1957 studied by Palmén and Holopainen (Geophysica, 1962) Workshop on "High-Resolution Climate Modeling" Lennart Bengtsson
Storm track genesis (top) and storm track density (below) for DJF 1970-1999left ERA40 analysis, right ECHAM5 (Clim.run, T213) Genesis ERA-40 ECHAM-5 T213 Track density Workshop on "High-Resolution Climate Modeling" Lennart Bengtsson
Identification of extreme extra-tropical events (see J. of Climate, May 2009) • We identify cyclones by searching for maximum of 850 hPa vorticity using data for every 6 hrs. • We search for the maximum wind within a radius of 5° of the vorticity centre. Wind speed is determined at 925 hPa • We calculate total precipitation in a circular area within 5° of the centre. ( ca 106 km2) • We also use surface pressure minima and surface pressure tendencies(deepening rates) • We show composite of the 100 most intense cyclones Workshop on "High-Resolution Climate Modeling" Lennart Bengtsson
Max. deepening ECHAM 5 T213 Cyclones in different stages of development Max. precipitation Max. intensity Workshop on "High-Resolution Climate Modeling" Lennart Bengtsson
Development of an intense extra-tropical cyclone ( composite of the 100 most intense storms) (DJF) at 20C. Time units are in 6 hours centered at the time of minimum pressure. Evolution of central pressure, vorticity, wind speed and precipitation 30 hours Workshop on "High-Resolution Climate Modeling" Lennart Bengtsson
Parameters of intense extra-tropical storms top ECHAM5 and ERA-40. Bottom ERA-40 and Interim re-analysis Workshop on "High-Resolution Climate Modeling" Lennart Bengtsson
Vertical tilt of the composite cyclone 36 hours before and after maximum intensity Workshop on "High-Resolution Climate Modeling" Lennart Bengtsson
Vertical tilt of the composite cyclone 36 hours before and after maximum intensity, ECHAM5 (top), ERA-40 (below) Workshop on "High-Resolution Climate Modeling" Lennart Bengtsson
Effect of resolution • We compare T213 with T63 • Using the same resolution (T42) the number and relative distribution of cyclones are the same) • At reduced resolution intensities are underestimated Workshop on "High-Resolution Climate Modeling" Lennart Bengtsson
Number of cyclones at &63 and T213 as a function of vorticity at T42 resolution Workshop on "High-Resolution Climate Modeling" Lennart Bengtsson
Intense cyclones at T63 and T213 resolution mm/1hr Workshop on "High-Resolution Climate Modeling" Lennart Bengtsson
Extra-tropical cyclones in a warmer climate • We explore a global climate simulation using a higher horizontal resolution than previously used in similar studies. • We use the ECHAM5 model at T213 resolution (ca 60km) and investigate 32 years from the 20th century, 1959-1990 (20C) and 32 years from the 21st century, 2069-2100 (21C). SST data are taken from a T63 coupled model. • We are making use of the A1B scenario • We explore transient storm track in a Lagrangian sense using data for every 6 hr. Workshop on "High-Resolution Climate Modeling" Lennart Bengtsson
Lifecycle composites of the 100 most intense storms in T42 ξ850 for the NH, DJF for T213 ECHAM5 in 21C and 20C (transparent colour). Parameters shown are MSLP (hPa) ( in black), ξ850 (10-5s-1), (in red) 925hPa winds (m s-1) (in green) and area averaged total precipitation (mm hr-1) ( in blue). Time step is 6 hours. Workshop on "High-Resolution Climate Modeling" Lennart Bengtsson
Windin a grid point space DJF Workshop on "High-Resolution Climate Modeling" Lennart Bengtsson
Wind speeds at 925 hPa (ca 400m above the surface) at the 99.9 percentile, ECHAM5 model at T213 resolution(60 km) For the period 1960-1990 Workshop on "High-Resolution Climate Modeling" Lennart Bengtsson
Change in wind speed maximum at the 99.9 percentiles. Calculated from all gridpoints every 6 hours, DJF Workshop on "High-Resolution Climate Modeling" Lennart Bengtsson
Hourly precipitation intensity at 20C (DJF), 99.9 percentile Workshop on "High-Resolution Climate Modeling" Lennart Bengtsson
Percentage change in hourly precipitation intensity between 21C and 20C (DJF), 99.9 percentile Workshop on "High-Resolution Climate Modeling" Lennart Bengtsson
Percentage increase i 6hr prec from 20C to 21C Workshop on "High-Resolution Climate Modeling" Lennart Bengtsson
Conclusions • Accumulated precipitation around extra tropical cyclones increase by some 11%. • Extreme precipitation ( accumulated over 6 hours) increases by more than 30% in some areas in the storm track region by more than 50%. • Extreme precipitation in a warmer climate will clearly fall outside the range ofpresent climate. • Extreme winds are likely to fall within the range of the present climate. Workshop on "High-Resolution Climate Modeling" Lennart Bengtsson
Tropical cyclones in a warmer climate- a modeling study- How may Tropical Cyclones Change in a Warmer Climate? (2007) Bengtsson, L., K. I. Hodges, M. Esch, N. Keenlyside, L. Kornblueh, J. Luo, T. Yamagata, Tellus. Workshop on "High-Resolution Climate Modeling" Lennart Bengtsson
Hurricane Katrina August 2005ECMWF operational analyses, 850 hPa vorticity Workshop on "High-Resolution Climate Modeling" Lennart Bengtsson
Katrina vorticity at different levels Workshop on "High-Resolution Climate Modeling" Lennart Bengtsson
Selection of TC indicators • We use criteria for minimum vorticity at 850 hPa (V), minimum vertical vorticity gradient (G) between 850 and 250 hPa, and number of time steps of 6 hrs (T) when these conditions are fulfilled. • (V, G, T) = (6, 6, 4) vorticity at 850 hPa = 6x10⁻⁵s-1 vorticity 850- 250 hPa = 6x10⁻⁵s-1 conditions fulfilled at least for 24 hrs (6, 6, 4) is defined as a TC Workshop on "High-Resolution Climate Modeling" Lennart Bengtsson
Structure of modeled tropical cyclones This shows the averaged structure of the 100 most intense storms at the time when the reach their maximum intensity Workshop on "High-Resolution Climate Modeling" Lennart Bengtsson
Tangential (left) and Radial winds (right) for the T63 resolution. Negative values inflow. Average of 100 tropical cyclones. At the time of maximum wind. Radius 5 degrees. Workshop on "High-Resolution Climate Modeling" Lennart Bengtsson
Tangential (left) and Radial winds (right) for the T213 resolution. Negative values inflow. Average of 100 tropical cyclones. Radius 5 degrees. The flow is predominantly inward to the rear and left of the storm and outward to the front and right (Frank 1977 MWR) Observations: Workshop on "High-Resolution Climate Modeling" Lennart Bengtsson
Tangential (left) and Radial winds (right) for the T319 resolution. Negative values inflow. Average of 100 tropical cyclones. Radius 5 degrees. Workshop on "High-Resolution Climate Modeling" Lennart Bengtsson
Hurricane Mitch: Tangential winds (left) and Radial winds (right) at 500 m. Units: 5 m/sKepert 2006 JAS outflow West Workshop on "High-Resolution Climate Modeling" Lennart Bengtsson
What is A1B? • Middle of the line scenario • Carbon emission peaking in the 2050s (16 Gt/year) • CO2 reaching 450 ppm. in 2030 • CO2 reaching 700 ppm. in 2100 • SO2 peaking in 2020 then coming done to 20% thereof in 2100 Workshop on "High-Resolution Climate Modeling" Lennart Bengtsson
SST difference (C 21-C 20) Workshop on "High-Resolution Climate Modeling" Lennart Bengtsson
TCs at T63 resolution C19 (black), C20 (red) and C21(blue) Workshop on "High-Resolution Climate Modeling" Lennart Bengtsson
T213 T213 All (6, 6, 4) >18ms-1 >2x10⁻⁴ s-1 >33ms-1 >5x10⁻⁴ s-1 >50ms-1 >1x10⁻³ s-1 20C (1961-1990) 20C (1961-1990) 104 100 97 33 40 3.7 6.0 21C (2071-2100) 21C (2071-2100) 94 92 90 36 4.9 49 9.8 Number of TCs/year (T213) for C 20 and C21 for wind speed and vorticity Workshop on "High-Resolution Climate Modeling" Lennart Bengtsson
TCs at C20 at four different resolutionsNumber/year as a function of vorticity Workshop on "High-Resolution Climate Modeling" Lennart Bengtsson
T319 Intensity changes 20C to 21C Workshop on "High-Resolution Climate Modeling" Lennart Bengtsson
Conclusions from the T319 resolution(40 km) • Results confirm the finding from the T213 experiment • The number of tropical cylones are reduced by some 10% at the end of the 21st century • The stronger storms are becoming more intense (Cyclones with wind speeds >50m/s increase from 12 to 17 per year compared to the end of the 20th century) Intensification occurs in all tropical storm regions Workshop on "High-Resolution Climate Modeling" Lennart Bengtsson
Why do we see a reduced number of tropical cyclones in a warmer climate? • We suggest the following mechanism • There is a reduction in the large-scale tropical circulation at climate warming due to increased static stability and to a slowing down of the large scale tropical circulation. • This generally leads to less favorable conditions to generate organized onset vortices which are seen as key atmospheric conditions for the generation of tropical storms. Workshop on "High-Resolution Climate Modeling" Lennart Bengtsson
Why do we see an intensification of the tropical storms in a warmer climate? • We suggest the following process • Due to chance favorable conditions are likely to evolve • In such situations the mechanisms proposed by Emanuel may be applied, that means that the maximum wind speed is proportional to the sqr. of the available latent energy provided to the storm • To demonstrate this with a GCM requires sufficient resolution ( say 50-100 km or less) Workshop on "High-Resolution Climate Modeling" Lennart Bengtsson
END Workshop on "High-Resolution Climate Modeling" Lennart Bengtsson