Download
1 / 44
440 likes | 582 Views
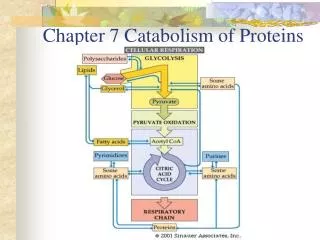
Relative quantification of proteins by 2D DIGE and label free LC-MS/MS 6 th European Summer School 19-25 August 2012 Martin Wells Brixen / Bressanone , Italy. Introduction. Relative quantification – what do we need? The challenges and limitations specific to proteomics

E N D
Relative quantification of proteins by 2D DIGE and label free LC-MS/MS 6thEuropean Summer School 19-25 August 2012 Martin WellsBrixen/Bressanone, Italy
Introduction • Relative quantification – what do we need? • The challenges and limitations specific to proteomics • The Progenesis software brand – concept and philosophy • The relative quant products: • Progenesis SameSpots for 2D gels • Progenesis LC-MS for proteomics • Progenesis CoMet for metabolomics • Progenesis MALDI
Nonlinear Dynamics Ltd. Who are we? • Nonlinear Dynamics develops proteomics and metabolomics analysis software that is different, ground-breaking and above all designed to help you generate reliable conclusions that are reproducible within and across-labs. • Founded 1989 • Head Office - Newcastle Upon Tyne, UK
Proteomics – Relative Quantification • Example applications • Discovery of protein expression changes related to disease or environment conditions • Characterisation of proteins or complexes to understand functionality and or activity
Relative quantification - What is the goal? “To discover the proteins that warrant further investigation as rapidly, objectively and reliably as possible.” Proteins x, y and z are significantly changing in their abundance as a apparent result of changes in the experimental conditions. Investigate these observation…
What do we need? • Experimental design that can answer the biological questions • Like for like measure of abundance across all samples to make relative comparisons • Correction for differences in sample loading • Reliable measure of variance within experimental groups • Statistical tools to confidently find differences that are significant and likely to be true • Identification workflow to annotate the measured features • Confirmation that other measurements are in consensus
Like for like measurements • Feature detection and matching has been one of the major challenges in relative quantitative proteomics data analysis, leading to time consuming subjective user editing and non-reproducible results. • Defining a feature consistently is more important to relative quantification than individual boundaries. • Independent detection of each files leads to inconsistent interpretation of features and matching challenges • How to handle / avoid “missing” data. Ie abundance measurement in only 3 out of 5 samples
Co-detection Mapping the detection to all runs avoiding missing data Aggregate co-detection
Data alignment – a prerequisite to co-detection Section prior to alignment Section after alignment
Precision of label free quantification – ion abundance 20 16 14 12 11 Mean number of FTMS data points/peak Human Lysate Digest 750ng 70 min separation mean peak width 90% Max ~21s CVs calculated on quintruplicate analyses of 47,482 multiply charged features Inst: Orbitrap XL and DionexRSLCn Duncan Smith, Paterson Institute for Cancer Research, Manchester
Quantitative Precision and Accuracy Not accurate, not precise Accurate, not precise Precise, not accurate Accurate and precise “The most complete dataset with accurate ratio’s and high precision was achieved by Progenesis” Richard R. Sprenger, USD, Odense - ASMS 2012 - Label-free absolute quantification of proteomes: evaluation and comparison of bioinformatics platforms and strategies
What do we need? • Experimental design that can answer the biological questions • Like for like measure of abundance across all samples to make relative comparisons • Correction for differences in sample loading
Correction for sample loading • If you loaded 20% more sample then most proteins will display a 20% increase in abundance, assuming… Data Normalisation Assuming like for like measurements are taken for all features you can calculate ratios for each feature. This is repeated to a common file for each sample. These ratios should on average be 1:1 assuming most proteins are not affected by the experimental condition.
Relative normalised abundances 5 groups with 3 replicates per group. Graphical expression profile showing group means with error bars representing 95% confidence bounds.
What do we need? • Experimental design that can answer the biological questions • Like for like measure of abundance across all samples to make relative comparisons • Correction for differences in sample loading • Reliable measure of variance within experimental groups
Reliable measure of variance • Technical noise • - e.g. experimentally introduced bias • Analytical inadequacies • - e.g. incorrect or missing quantification of experiment data • Biological variation • - how do we handle this? These obstacles result in a loss of power and, therefore, a reduction in our ability to confidently discover significant expression changes
Reliable measure of variance • Determining the variance of the abundance measurement enables determination of confidence bounds. (95%) • The greater the number of replicates the smaller the confidence interval - in a well controlled environment. • Variance if often proportional to the mean. • The confidence of any reported difference or POWER is a relationship between the size of the confidence intervals and the effect size.
What do we need? • Experimental design that can answer the biological questions • Like for like measure of abundance across all samples to make relative comparisons • Correction for differences in sample loading • Reliable measure of variance within experimental groups • Statistical tools to confidently find differences that are significant and likely to be true
Statistical tools • Know the assumptions and limitations of the test you apply • Student T-test and One-way ANOVA assume: • Normal distribution • Equal variance • Sample independence • To achieve the above a data transformation is typically required. • Proteomics data is typically log distributed and requires a transformation to meet the pre-requisites of many statistical tests Log distribution Normal distribution
Uni and multivariate statistics The complete data table of quantitative information, without missing data, enables the robust and confident application of multivariate statistics to support traditional univariate tests. • Principle component analysis PCA • ANOVA p-values, typically p<0.05 – ie 5% type I error (false positive) • False discovery rate p value “correction” – q values to reduce type 1 errors • Power analysis per feature to reduce type II errors (false negative) • Correlation analysis of proteins or peptides ions abundances • See which protein abundances are highly correlated. Is there a biological cause to this effect. • The greater the biological variation the more reliable this relationship.
Principle component analysis Fantastic overview of your data, enabling assessment of the major contributing factors (principle components) to variance in your experiment. Eg. Are all the files within each group showing similar overall characteristics to each other. Are all groups different to all other groups or just one group is different to the rest.
False discoveries and q-values • False discoveries occur when we are observing a difference when in truth there is none, thus indicating a test of poor specificity. Q-values are a tool to reduce such false discoveries • False Discovery Rate (FDR) assumes a uniform distribution of p-values but ... Theoretical p-value distribution Actual p-value distribution • q-values take the into account the actual p-value distribution and can be referred to as a corrected p-value [1] Storey,J.D. and Tibshirani,R. (2003) Statistical significance for genomewide studies. Proc. Natl Acad. Sci. USA, 100, 9440–9445.
Find similarexpression profiles Link protein expression to pathways Label Free LC-MS Based Proteomics for Integrated Preclinical Pharmaceutical Toxicology. Experience from the FP6 InnoMedPredTox Consortium. Scientific poster presented by Dr. Ben Collins from University College Dublin, Ireland. ASMS, 2010.
What do we need? • Experimental design that can answer the biological questions • Like for like measure of abundance across all samples to make relative comparisons • Correction for differences in sample loading • Reliable measure of variance within experimental groups • Statistical tools to confidently find differences that are significant and likely to be true • Identification workflow to annotate the measured features
Identification workflow with co-detection Peptide ion indentified obtained from any one file No Missing data! Identification can be confirmed by any other file(s)
Should MSMS acquisition simple be replicated for each sample? 22min iGPF DDA A MSMS of 400-525 (7.8% mz window) B MSMS of 525-638 (7.0% mz window) RT C MSMS of 638-766 (8.0% mz window) Quintuplicate analysis gives 5 Identical LCMS experiments/sample D MSMS of 766-963 (12.3% mz window) iGPF gives 5 completely different LCMSMS experiments/sample E MSMS of 963-2000 (64.8% mz window) 92min 400 2000
41,482 multiple charge ions Identification workflow • Using iGPF 3.5 time more peptides were identified compared to DDA. • Many of the ‘unsuccessful’ MS2 spectra are very weak due to the low abundance of the precursor. • iGPF 16,285 • (39%) • 41,482 multiply charged ions quantified from MS1 data • FDR <1% • Further 2D-LC-MSMS annotations yielded an additional 10,100 peptide ID’s due to a reduction in complexity and increased on column concentration • DDA 4,522 • (11%) Duncan Smith, Paterson Institute for Cancer Research, Manchester
What do we need? • Experimental design that can answer the biological questions • Like for like measure of abundance across all samples to make relative comparisons • Correction for differences in sample loading • Reliable measure of variance within experimental groups • Statistical tools to confidently find differences that are significant and likely to be true • Identification workflow to annotate the measured features • Confirmation that any other measurements are in consensus
Protein Abundance Results • Multiple measurements identified as unique and from the same protein can be collated and the protein abundance calculated. • However you may have several reported fold changes – so which is correct?
Protein “Abundance” Results • Are all peptide measurements in agreement? Or do some peptides reflect modification differences between groups rather than abundances changes. • Activation of the same quantity of protein may result in some peptides changing significantly whilst all others remaining constant. • Are there any technical (egmiscleavage) or biological (eg PTM) outliers that need filtering outof the “abundance” measure.
Progenesis LC-MS analytical workflow • Directly load vendor data files • Apply lock-mass correction • Apply dead time correction (if applicable) Data Import RT Alignment Wikipedia LABEL FREE QUANTIFICATION Automatic detection normalisation & quantification of LC-MS data at the peptide level View Results & Peptide Ion Quantification Set-up experiment groups Multivariate Statistical Analysis THEN IDENTIFY Generate additional MSE/MS2 data to annotate quantification data Report Peptide Search & Import Results Protein View & Quantification
Analyse fractionated samples Inclusion lists Analysis of Each Fraction Reduce sample complexity but quantify more runs Recombine Fractions Normalise across fractions to see global view Protein View Quantification & identification at the protein level View Peptide Data Delve into underlying peptide information
Normalising pre-fractionated data • Two step process • Standard normalisation within each fraction • Use common abundance distribution characteristics to normalise between fractions
Precision and Accuracy – what’s needed? Precision is more common to see reported and maybe easier to access with technical repetition Is 15%-20% Precision good – is it good enough?? Effect Size - The fold change between the groups The POWER – combination of both the above may be more suitable and relevant to differential expression results. Also takes into consideration of the sample size. Accuracy is more challenging and requires some prior knowledge . Ie the “correct” or target answer. Is 15-20% Accuracy good – is it good enough?? FDA Guidance for Industry - Bioanalytical Method Validation The precision should not exceed 15% of the coefficient of variation (CV) except for the LLOQ, where it should not exceed 20% of the CV. The accuracy should be within 15% of the actual value except at LLOQ, where it should not deviate by more than 20%.
Impact of Precision to relative quant ~15% CV ~30% CV ~50% CV
What analytical precision is needed? p<0.05 For relative quant would it be more appropriate to report POWER than precision or even fold change? Something that is close to the limits of detection (LOD) is likely to have poor precision (in that group) but if the effect size (fold change) is large then any short coming in precision may not be critical to the significance of the observed difference. p<0.05 Would statistical POWER be more informative?
Precision and Accuracy – what’s needed? Accuracyis more challenging and requires some prior knowledge . Ie the “correct” or target answer. Is 15-20% Accuracy good – is it good enough?? 60 50 40 30 20 10 fmol
Conclusion • Relative quantification of proteomics data can provide some extremely powerful biological insight. • A clear understanding of the software tools, their assumptions and limitations are vital to the correct interpretation of the data. • Knowledge of the major contributors to technical variance in your whole workflow and the control and monitoring of this can greatly impact your confidence in the results.
The Progenesis product range • Progenesis SameSpots for 2D gels • Progenesis LC-MS for proteomics • Progenesis CoMet for metabolomics • Progenesis MALDI www.nonlinear.com
Acknowledgements • Colleagues at Nonlinear Dynamics • Duncan Smith et al, Paterson Institute for Cancer Research, Manchester Thank you for your attention • Stats glossary http://www.stats.gla.ac.uk/steps/glossary/index.html