Download
1 / 14
140 likes | 282 Views
Football Helmet Acceleration. By: Richard Pape And Larkin Heintzman Instructor: Doug Harper. What is O ur Project. Our project is to build a model for the acceleration of a football helmet during a collision. The Impact will be delivered by a small hammer. What's the Point?.

E N D
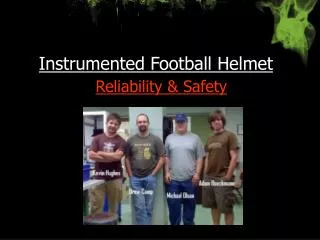
Football Helmet Acceleration By: Richard Pape And Larkin Heintzman Instructor: Doug Harper
What is Our Project • Our project is to build a model for the acceleration of a football helmet during a collision. • The Impact will be delivered by a small hammer
What's the Point? • Determining the forces being applied to a football helmet during a collision could be useful in the following ways: • Helping athletes avoid major head trauma • Determining where more padding is required inside the helmet • Working towards building a complete model for the accelerations on the helmet during various types of collisions
Methods We Will Use • Our main program will have the following capabilities: • An “Acquire” feature • Used to receive the data from the accelerometers • Data will be plotted live • The data sampling rate is adjustable • And a “Playback” feature • Used to replay previously acquired data • Has the capability to stop, rewind, and pause the playing data. • Speed of replay is adjustable
Methods We Will Use • To build the model of acceleration we will implement several things: • 7 Accelerometers • Communicate via SPI (Serial Peripheral Interface) • Capable of tracking the X, Y, and Z axis's. • The myRIO data acquisition system • Able to run LabVIEW programs without the need for a computer. • And a computer to view the results of a test • For the purpose of displaying the data from a test in a user friendly format.
What is SPI? • SPI is a synchronous serial communication protocol • Can be used with multiple peripheral devices • Generally has one master device, and one or more servant devices • SPI is a 4 wire connection • MISO = Master In Servant Out • MOSI = Master Out Servant In • SS = Servant Select • SCK = Serial Clock
Prototype Front Panel Recording
Prototype Front Panel Playback
Progress to Date: • Determining the best placement of the accelerometers on the football helmet. • Achieving SPI communication with the accelerometers chosen for this project • Testing the accelerometers for functionality
Next Steps for Project • Attach the necessary accelerometers to the football helmet • Finalize user interface • Develop standard viewing system for user interface • Carry out testing with all accelerometers attached to the helmet, and gather results
The Testing Process • The steps of the testing are as follows: • Attach accelerometers to the helmet • Test acquire function by applying an impact to the helmet • Test playback function by reviewing the previously gathered data • Review overall performance of the program
Why is Our project unique? • Our project is unique in the following ways: • We must interface with multiple sensors via SPI • We must develop a format to view several graphs in a user friendly way • And lastly we must develop a playback system in our program • In order to accomplish this, we will develop a way to store the data so that we can play it back when the user requests
Closing Remarks • The main challenges that remain are: • Building the system that allows us to gather data from the impacts • And developing a user friendly graphing method After we accomplish those two main tasks, we will continue with the actual testing of the system.