Download
1 / 23
230 likes | 425 Views
Ch 1.1. Functions and Graphs. Functions. Functions are useful not only in Calculus but in nearby every field students may pursue. We employ celebrated “ Rule of Four ” all problems should be considered using Algebraic Method Verbal Algebraic Expression Numerical

E N D
Ch 1.1 Functions and Graphs
Functions Functions are useful not only in Calculus but in nearby every field students may pursue. We employ celebrated “ Rule of Four” all problems should be considered using Algebraic Method • Verbal • Algebraic Expression • Numerical • Graphical Students learn to write algebraic expression from verbal description, to recognize trends in a table of data, extract & interpret information from the graph of a function
Graphs • No tool for conveying information about a system is more powerful than a graph • Large number of examples are explained plotting by hand and using graphing calculator (TI 83/84)
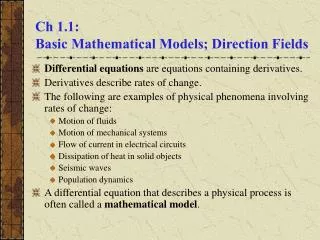
Ch 1 - Linear Model Mathematical techniques are used to Analyze data Identify trends Predict the effects of change • This quantitative methods are the concepts of skills of algebra • You will use skills you learned in elementary algebra to solve problems and to study a variety of phenomena • the description of relationships between variables by using equations, graphs, and table of values. This process is called Mathematical Modeling
General Form For a Linear Equation The graph of any equation Ax + By = C Where A and B are not both equal to zero, is a straight lines
Linear Equations All the models for examples have equations with a similar form Y = ( starting value ) + ( rate of change ) . X Graph will be straight lines So we called these are Linear Equations For Example C = 6 + 5t This can be written equivalently as • 5t + C = 6 (subtract 5t from both sides ) So It is a linear equation Note : General Form for a Linear Equation The graph of any equation Ax + By = C Where A and B are not both equal to zero, is a straight line
Intercepts of a Graph Intercepts of a graph The points where a graph crosses the axes are called the intercepts of the graph • To find the x-intercepts, set y = 0 and solve for x • To find the y-intercepts, set x = 0 and solve for y To Graph a Line Using the Intercept Method: • Find the intercepts of the line • To find the x-intercept, set y = 0 and solve for x • To find the y-intercept, set x = 0 and solve for y. 2. Plot the intercepts. 3. Choose a value for x and find a third point on the line. 4. Draw a line through the points
Example 17 , Pg = 16 Find the intercepts of the graph and graph the equation by the intercept method x _ y = 1 9 4 Solution,Set x = 0, 0 _ y 9 4 = 1 - y 4 = 1 , y = - 4 The y-intercept is the point (0, - 4) Set y = 0, x - 0 = 1 9 4 x = 1 , x = 9 9 The x-intercept is the point (9, 0) x-intercept (9, 0) (0, -4) y-intercept
Graphing an Equation To graph an equation: ( in Graphing Calculator) • PressY = and enter the equation you wish to graph • PressWINDOW and select a suitable graphing window • PressGRAPH • Press2nd and Table
Using Graphing Calculator to solve the equation, Equation 572 – 23x = 181 Y1 Y2 Press Window and enter Press Y1 and Y2 and enter Press 2nd and Table Press Graph and Trace
Ex 1.1 , 39 ( Pg 18)a) Solve the equation for y in terms of xb) Graph the equation on your calculator in the specified windowc) Make a pencil and paper sketch of the graphLabel the scales on your axes, and the coordinates of the intercepts 3x - 4y = 1200 Xmin = - 1000 Ymin = - 1000 Xmax = 1000 Y max = 1000 XSc1 = 1 YSc 1 = 1 Solution – 3x – 4y = 1200 Find y in the given equation -4y = - 3x + 1200 ( Isolate y) y = -3/-4 x + 1200/-4 y = ¾ x – 300 Y1 = ¾ x - 300 Hit Y, Enter Y1 = ¾ x - 300 Hit Graph Hit Window , Enter the values
Graphing Calculator Press Y = key, Enter Y1 = 1454 –16X2 Press 2nd WINDOW to access the Tbl Set start from 0 And the increment of one unit in the x values , Press 2nd and graph for table Press graph Press WINDOW
Ex4( pg 15) Leon’s camper has a 20-gallon gas tank and he gets 12 miles to the gallon. (that is , he uses gallon per mile) Complete the table of values for the amount of gas, g, left in Leon’s tank after driving m miles Solution • Write an equation that expresses the amount of gas, g, in Leon’s fuel tank in terms of the number of miles, m, he has driven. • Graph the equation • How much gas will Leon use between 8am, when his odometer reads 96 miles, and 9 a.m, when the odometer reads 144 miles ? Illustrate the graph • If Leon has less than 5 gallons of gas left, how many miles has he driven ? Illustrate on the graph. P.T.O
Leon has traveled more than 180 miles if he has less than 5 gallons of gas left Exercise 1.1 ( Example 4, pg – 15) g 0 4 8 12 16 20 24 200 180 175 150 125 100 75 50 25 Table m The Equation g = 20 – 1 m 12 m 0 48 96 144 192 g 20 16 12 8 4 Let g = 5, 5 = 20 – 1 m 12 60 = 240 – m (Multiply by 12 both sides ) - - 180 = - m (multiply by – 1 both sides) m = 180 4 gallons
Function Notation f(x) = y Input Variable Output Variable Example y = f(x) = 1454 –16x2 When x= 1, y= f(1)= 1438, We read as“f of 1 equals 1438” When x = 2, y = f(2) =1390, We read as “ f of 2 equals 1390 ”
As of 2006, the Sears Tower in Chicago is the nation’s tallest building, at 1454 feet. If an algebra book is dropped from the top of the Sears Tower, its height above the ground after t seconds is given by the equation h = 1454 –16t2 Ch 1.2 Function Notation f(t) = h Independent VariableDependent Variable This function t = Input variable and h is the output variable Example h = f(t) = 1454 –16t2 When t= 1, i.e after 1 second the book’s height, h= f(1)= 1454 – 16 (1)2 =1438 feet, We read as “f of 1 equals 1438” When t = 2, h = f(2) = 1454 – 16(2)2 = 1390 feet, We read as” f of 2 equals 1390 “
Definition of function ( Pg 19) A functionis a relationship between two variables for which a unique value of theoutput variable can be determined from a value of the input variable. Function Notation f(x) = y Input variable Output Variable
Ch 1.2 (pg 19) Definition and Function Example –To rent a plane flying lessons cost $ 800 plus $30 per hour Suppose C = 30 t + 800 (t > 0) When t = 0, C = 30(0) + 800= 800 When t = 4, C = 30(4) + 800 = 920 When t = 10, C = 30(10) + 800 = 1100 The variable t in Equation is called the input or independent variable, and C is the output or dependent variable, because its values are determined by the value of t. This type of relationship is called a function Table Ordered Pair Output Input
1.2 Functions defined by Tables (24 Pg 31) Check the following tables whether the second variable as a function of the first variable? Explain why or why not ? 1972 and 1977 same inflation Rate 5.6 % But two different Unemployment rates 5.1% and 6.8% Not a function: Some values of table I have more than one value of table U
No26 It is a function: Each value of M has a unique value of C
a)When did 2000 students consider themselves computer literate ? Ans- In 1991 b)How long did it take that number to double? Ans Value of C doubled from 2 to 4 in one year c)How long did it take for the number to double again? Ans- From 4 to 8 in one year d) How many students became computer literarate Ans- t starts from January 1990 In the beginning January 1992, t = 2 and C = 4, so 4000 students were computer literate. In the beginning of June 1993, t = 3 = 3.4 and C = 11. So 11,000 students were computer literate. Thus 11,000 – 4000 = 7000 students became computer literate between January 1992 and June 1993 Graph of the function C No35 15 14 13 12 11 10 9 8 7 6 5 4 3 2 1 No of students in thousands -1 0 1 2 3 4 5 6 7 8 t measured in years 1990
Evaluate each function for the given values (pg 34 ) • f(x) = 6 -2x • f(3) = 6 – 2(3)=0 • f(-2)= 6 – 2(-2)= 6 + 4= 10 • f(12.7)= 6 -2(12.7) = 6 – 25.4 = -19.4 • f( ) = 6 – 2( ) = 6 - = 4 48 D( r) = 5 – r • d(4) = 5 -4 = 1 • d( - 3) = 5 – (-3) = = 2.828 • d(-9)= = = 3.742 • d(4.6)= = = 0.632
1.2 pg 37 Evaluate the function and simplify 61. g(x) = 8 • g(2) = 8 • g(8) = 8 • g(a+1) = 8 • g(-x) = 8 64. Q(t) = 5t3 • Q(2t) = 5(2t)3= 40 t3 • 2Q(t) = 2.5t3 = 10t3 • Q(t2) = 5 (t2)3= 5t6 • [Q(t)]2 = (5t3)2 = 25t6