Download
1 / 37
370 likes | 474 Views
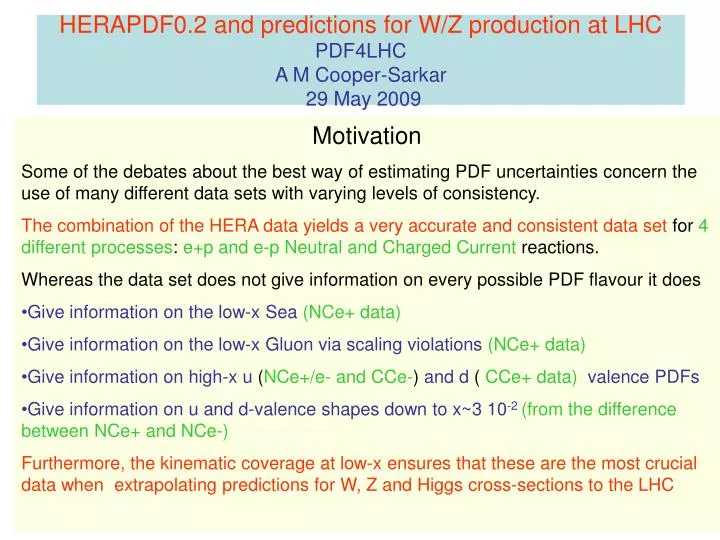
HERAPDF0.2 and predictions for W/Z production at LHC PDF4LHC A M Cooper-Sarkar 29 May 2009. Motivation Some of the debates about the best way of estimating PDF uncertainties concern the use of many different data sets with varying levels of consistency.

E N D
HERAPDF0.2 and predictions for W/Z production at LHCPDF4LHCA M Cooper-Sarkar 29 May 2009 • Motivation • Some of the debates about the best way of estimating PDF uncertainties concern the use of many different data sets with varying levels of consistency. • The combination of the HERA data yields a very accurate and consistent data set for 4 different processes: e+p and e-p Neutral and Charged Current reactions. • Whereas the data set does not give information on every possible PDF flavour it does • Give information on the low-x Sea(NCe+ data) • Give information on the low-x Gluon via scaling violations(NCe+ data) • Give information on high-x u (NCe+/e- and CCe-) and d ( CCe+ data) valence PDFs • Give information on u and d-valence shapes down to x~3 10-2(from the difference between NCe+ and NCe-) • Furthermore, the kinematic coverage at low-x ensures that these are the most crucial data when extrapolating predictions for W, Z and Higgs cross-sections to the LHC
Correlated systematic uncertainties, χ2 and Δχ2 The data combination results in a data set which not only has improved statistical uncertainty, but also improved systematic uncertainty. Even though there are 113 sources of correlated systematic uncertainty on the data points these uncertainties are small. The total systematic uncertainty is significantly smaller than the statistical uncertainty across the the kinematic region used in the QCD fits This means that the method of treatment of correlated systematic uncertainties in our PDF fits is not crucial. We obtain similar results treating all systematic errors as correlated or as uncorrelated. For our PDF fits we combine 110 sources of systematic uncertainty from the separate experiments in quadrature and OFFSET the 3 procedural systematics which derive from the method of data combination. The form of the χ2 that we use for the PDF fit is the same as that used for the data combination- see talk of Sasha Glazov. We set the uncertainties on our PDFs at 68% CL by the conventional χ2 tolerance Δχ2 = 1
Theoretical framework Fits are made at NLO in the DGLAP formalism -using QCDNUM 17.02 (update to 17.04 is consistent) NNLO is work in progress The Thorne-Roberts massive variable flavour number scheme is used (2008 version) The starting scale Q20 (= 1.9 GeV2)is below the charm mass2(mc=1,4 GeV) and charm and beauty (mb=4.75) are generated dynamically A minimum Q2 cut Q2 > 3.5 GeV2 is applied to stay within the supposed region of validity of leading twist pQCD (no data are at low W2) Parametrisation andmodel assumptions (all values in green are varied) We chose to fit the PDFs for: gluon, u-valence, d-valence and the Sea u and d-type flavours: Ubar = ubar, Dbar = dbar+sbar (below the charm threshold) To the functional form The normalisations of the gluon and valence PDFs are fixed by the momentum and number sum-rules resp. B(d-valence) = B(u-valence) (can be varied),B(Dbar) = B(Ubar), A(Ubar) = A(Dbar) (1-fs), where sbar = fs Dbar, so that ubar → dbar as x→ 1 (fs=0.31)
Uncertainties due to model assumptions are evaluated by varying the following inputs Since there is no HERA information on the strange PDF the strange sea fraction is varied by an amount which covers the recent findings of MSTW/CTEQ
Choice of parametrisation- variations in parametrisation • All fits vary the A,B,C parameters (if not covered by the restrictions on p 3) we then search for good fits with the D and E parameters free • Our central fit has E(u-valence) free and all other D,E parameters zero (10 parameters) • This is chosen as the central fit not only because of its good χ2 = 576 for 592 data points but also because: all PDFs are +ve and d-valence > dbar at high-x • However, other possibilities are consider as paramerisation uncertainties • Those which produce significant changes in PDF shapes are 11 parameter fits with: • D(u-valence) also free • D(Ubar) also free • D(Dbar) also freebut all other variants with non-zero D and E were tried • No formal χ2 requirement was put on these alternative fits -such as requiring, Δχ2 < √2 N ~30, from our central fit (hypothesis testing criterion) -but in practice they differ from our central fit by Δχ2 < 10. • The envelope of these fits is used as the parametrisation uncertainty. • And we aren’t finished yet- work is still in progress
Results Compare HERAPDF0.1 and 0.2 Experimental uncertainties have decreased- mostly due to newly published H1 data Gluon is steeper- mostly due to massive heavy quark treatment This reflects the limitations of HERA-I data – HERA-II will improve this
Comparison to CTEQ/MSTW We compare to the global fits using their 68%CL estimates since we use Δχ2=1 However since we also add model and parametrisation uncertainties this is not completely rigorous Clearly the combined HERA data give strong constraints on low-x sea and gluon
Also look at flavour separation in the sea – for strange this has input model dependence for charm it derives from the gluon Uncertainties are reduced at higher scale for sea and gluon
Now look at the scale of the W and Z Q2~10,000 GeV2 PDF parametrisation uncertainty is still sizeable for valence PDFs and at high-x But for the gluon and Sea in the low-x region which is relevant for W and Z production at central region there is impressive precision
Summary on HERAPDF0.2 Impressive precision on the low-x sea and gluon particularly relevant for W, Z production at LHC
Now let’s apply this to predictions for W and Z production at LHC What changes about W/Z production for LHC running 10 TeV rather than 14 TeV The central rapidity range for W/Z production AT LHC is still at low-x (6 ×10⁻⁴ to 6 ×10⁻²) at 14 TeV (8.5 ×10⁻⁴ to 8.5 ×10⁻²) at 10 TeV Just slightly higher than before The W and Z cross-sections decrease to ~70% of their values at 14TeV. This means there will still be millions of events.
MRST PDF NNLO corrections small ~ few% NNLO residual scale dependence < 1% W/Z production have been considered as good standard candle processes with small theoretical uncertainty. PDF uncertainty is THE dominant contribution and most PDF groups quote uncertainties <~3% (at 68%CL) W Z cross-sections at 10 TeV Agreement between PDFs which include massive heavy quark treatment is also to ~3% Can be used as a luminosity monitor? HERAPDF0.2 experimental uncertainties are VERY small Model/parametrization uncertainties increase this… But still comparable to CTEQ/MSTW
WHY DO WE KNOW these cross-sections SO WELL? BECAUSE OF HERA. Look in detail at predictions for W/Z rapidity distributions: Pre- and Post-HERA Note difference in scale for fractional errors Pre HERA Post HERA -including ZEUS data Why such an improvement? It’s due to the improvement in the low-x sea and gluon At the LHC the q-qbar which make the boson are mostly sea-sea partons And at Q2~MZ2the sea is driven by the gluon These illustrations at 14 TeV
Of course global fits like CTEQ/MSTW include data from BOTH HERA experiments but they don’t yet include the HERA combined data This combination is not just a statistical improvement. Each experiment can be used to calibrate the othersince they have rather different sources of experimental systematics Before combination the systematic errors are ~3 times the statistical for Q2< 100 After combination systematic errors are < statistical Combination was done in 2008 BUT more very precise H1 data has been added in 2009
PDFs from same QCD analysis of separate ZEUS and H1 data sets -before combination PDFs from same QCD analysis of combined HERA data - after combination 2008 PDFs from same QCD analysis of combined HERA data - after combination 2009 HERAPDF0.1 has very small experimental errors model errorswere also added HERAPDF0.2 has even smaller experimental errors model errors and parametrisation errorswere added Experimental error only
Predictions for WZ prodn from including HERA data in PDF fit before data combination Predictions for WZ prodn from HERAPDF0.1 after data combination Using the HERA combined data (2008) and then improving the HERA combined data (2009) leads to smaller and smaller experimental uncertainties on the predictions for W/Z production at central rapidity, because the HERA data improve the low-x sea and gluon PDFs Predictions for WZ prodn from HERAPDF0.2 after new data combination These illustrations at 14 TeV
HERAPDF0.1 experimental plus model errors HERAPDF0.2 experimentalplus model errors However it is a different story with model uncertainties Model dependence is larger in HERAPDF0.2. This is mostly becausein HERAPDF0.2 we use a general mass variable flavour number scheme rather than a zero-mass scheme and so variation of the charm mass affects the predictions more- smaller mass (closer to zero-mass) lowers the W,Z cross-sections and heavier mass raises them (as observed by CTEQ). These illustrations at 14 TeV
HERAPDF0.2 experimental plus model errors HERAPDF0.2 experimental plus model errors plusparametrisation Now let’s study HERAPDF0.2 parametrisation uncertainty- this affects at larger rapidity (mostly larger x) –will improve with HERA-II data These illustrations at 14 TeV
HERAPDF0.2 experimental plus model errors plusparametrisation HERAPDF0.2 experimental plus model errors plusparametrisation 14 TeV 10 TeV And one further point- the blue line on these plots illustrates the effect of variation of αS(MZ) from 0.1176 to 0.1196 .. Not a major source of uncertainty
CTEQ6.6 PDF predictions at 68%CL 10 TeV NEW HERAPDF0.2 predictions 10 TeV 14 TeV plots in EXTRAS HERAPDF0.2 predictions for W/Z and lepton rapidity spectra are compatible with those of CTEQ66 in central values. HERA experimental uncertainties are VERY small but model uncertainty and parametrisation uncertainty result in a similar overall level of uncertainty at central rapidity.
MSTW08 with 68% CL uncertainty bands (MRST01 is shown as line) 10 TeV NEW HERAPDF0.2 predictions 10 TeV HERAPDF0.2 predictions for W/Z and lepton rapidity spectra are compatible with those of MSTW08 in central values.HERA experimental values are VERY precise but model dependence and parametrisation dependence are important
Now let’s look at ratios: Z/W ratio is a golden benchmark measurement - 10TeV MSTW08 CTEQ6.6 HERAPDF0.2 CTEQ6.5 pre 2008 ZOOM in on Z/W ratio – there is fantastic agreement between PDF providers PDF uncertainty from the low-x gluon and flavour symmetric sea cancels out- and so do luminosity errors BUT there is somewhat more PDF uncertainty than we thought before 2008 (~1.5% rather than <1% in the central region) There is uncertainty in the strangeness sector that does not cancel out between Z and (W+ + W-)… it was always there we just didn’t account for it Z = uubar + ddbar + ssbar +ccbar +bbar W+ + W- ~ (udbar + csbar) + (dubar+scbar) YES this does translate to the Z/lepton ratio
But in the W asymmetry – there is NOT fanatastic agreement -10 TeV CTEQ6.6 HERAPDF0.2 MSTW08 Lepton asymmetry The differences between PDFs at central rapidity are due to different low-x valence behaviour – PDF uncertainties are probably underestimated (Anyone who doubts this is coming from the valence-sector can look in EXTRAS)
Summary on WZ • Prediction of W/Z at LHC from HERAPDF0.2 based on optimal HERA data combination –sorts out experimental uncertainty from model uncertainty from parametrisation uncertainty • For W, Z and decay lepton rapidity spectra in the central region • Very smallexperimental uncertainty < 1%. • Model uncertainty ~2.5% from value of m_c and choice of Q20 • Parametrisation uncertainty <~2% (But larger at high rapidity) • HERA combination improves our ability to make precision SM predictions for the LHC • For Z/W ratio • 1. Very smallexperimental uncertainty~1% and Very small model/param uncertainty in both Z/W ratio and Z/lepton ratio~1-2 • Golden SM benchmark measurement • For W asymmetry • Experimental uncertainty~5%. Remaining model/parametrisation uncertainty in W and lepton asymmetry can be even larger • LHC measurements will increase our knowledge of PDFS
Dominantly, at LO Aw= (u dbar – d ubar) (u dbar + d ubar) And ubar ~ dbar ~ qbar at small x So Aw~ (u – d) = (uv – dv) (u + d) (uv + dv + 2 qbar ) Predictions for AW are different in the central region- because predictions for valence distributions at small-x are different y=0 Actually this LO approx. is pretty good even quantitatively The difference in valence PDFs you see here does explain the difference in AW between MSTW and CTEQ x- range affecting W asymmetry in the measurable rapidity range at ATLAS (10TeV)
CTEQ6.6 PDF predictions at 68%CL NEW HERAPDF0.2 predictions HERAPDF0.2 predictions for W/Z and lepton rapidity spectra are compatible with those of CTEQ66 in central values. HERA experimental values are VERY precise but model dependence and parametrisation dependence result in a similar overall level of uncertainty at central rapidity. These illustrations at 14 TeV
MSTW08 with 68% CL uncertainty bands MRST01 is shown as line NEW HERAPDF0.2 predictions HERAPDF0.2 predictions for W/Z and lepton rapidity spectra are compatible with those of MSTW08 in central values.HERA experimental values are VERY precise but model dependence and parametrisation dependence are important These illustrations at 14 TeV
Now let’s look at ratios W asymmetry and Z/(W+ + W-) ratio W asymmetry and Z/(W+ + W-) ratio lepton asymmetry and Z/(leptons) ratio lepton asymmetry and Z/(leptons) ratio CTEQ6.6PDF predictions 68%CL NEW HERAPDF0.2 predictions The Z/W ratio and the Z/lepton ratio are predicted very consistently between different PDF providers The W asymmetry and lepton asymmetries are not so consistent. This is due to differences in the uv-dv PDF This is still at 14TeV
Now let’s look at ratios W asymmetry and Z/(W+ + W-) ratio W asymmetry and Z/(W+ + W-) ratio lepton asymmetry and Z/(leptons) ratio lepton asymmetry and Z/(leptons) ratio CTEQ6.6PDF predictions 68%CL At 10 TeV NEW HERAPDF0.2 predictions At 10 TeV The Z/W ratio and the Z/lepton ratio are predicted very consistently between different PDF providers The W asymmetry and lepton asymmetries are not so consistent. This is due to differences in the uv-dv PDF
Now let’s look at ratios W asymmetry and Z/(W+ + W-) ratio W asymmetry and Z/(W+ + W-) ratio lepton asymmetry and Z/(leptons) ratio lepton asymmetry and Z/(leptons) ratio MSTW08 PDF predictions 68%CL NEW HERAPDF0.2 predictions The Z/W ratio and the Z/lepton ratio are predicted very consistently between different PDF providers. The W asymmetry and lepton asymmetry are not so consistent. This is due to differences in the uv-dv PDF This is still at 14 TeV
Now let’s look at ratios W asymmetry and Z/(W+ + W-) ratio W asymmetry and Z/(W+ + W-) ratio lepton asymmetry and Z/(leptons) ratio lepton asymmetry and Z/(leptons) ratio NEW HERAPDF0.2 predictions At 10 TeV MSTW08 PDF predictions 68%CL At 10 TeV The Z/W ratio and the Z/lepton ratio are predicted very consistently between different PDF providers. The W asymmetry and lepton asymmetry are not so consistent. This is due to differences in the uv-dv PDF
Now let’s look at ratios: Z/W ratio is a golden benchmark measurement (14TeV) CTEQ6.6 MSTW08 (MRST01) CTEQ6.5 pre 2008 HERAPDF0.2 ZOOM in on Z/W ratio – there is fantastic agreement between PDF providers PDF uncertainty from the low-x gluon/ flavour symmetric sea cancels out- and so do luminosity errors BUT there is somewhat more PDF uncertainty than we thought before 2008 (~2% rather than 1% in the central region) There is uncertainty in the strangeness sector that does not cancel out between Z and (W+ + W-)… it was always there we just didn’t account for it Z = uubar + ddbar + ssbar +ccbar +bbar W+ + W- ~ (udbar + csbar) + (dubar+scbar) YES this does translate to the Z/lepton ratio
But in the W asymmetry – there is NOT fanatastic agreement (14TEV) MSTW08 (MRST01) CTEQ6.6 HERAPDF0.2 Lepton asymmetry Further sources of PDF uncertainty from the valence sector are revealed.