Download
1 / 16
160 likes | 264 Views
Using Sound to Represent Uncertainty in UK Climate Predictions 2009 Data: Communication of Uncertainty. Nick Bearman Phil Jones Andrew Lovett. Uncertainty. All data have some uncertainty but it is often not represented or used in a particularly helpful way

E N D
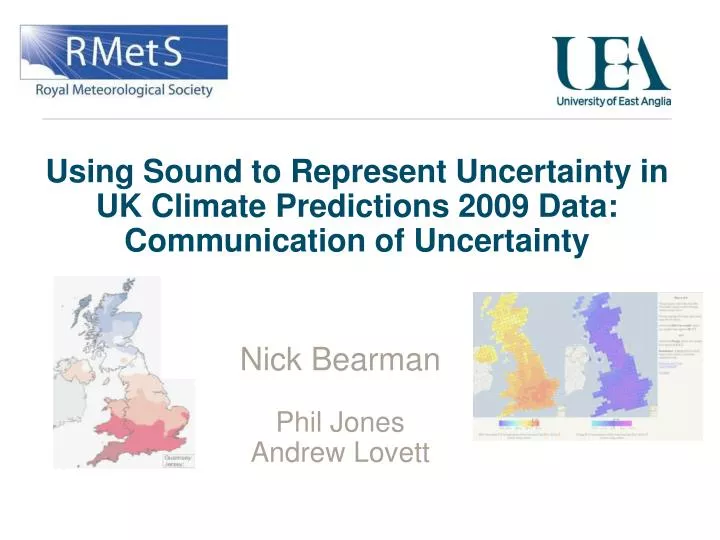
Using Sound to Represent Uncertainty in UK Climate Predictions 2009 Data:Communication of Uncertainty Nick Bearman Phil Jones Andrew Lovett
Uncertainty • All data have some uncertainty • but it is often not represented or used in a particularly helpful way • People* generally are not comfortable with the concept of uncertainty • Mobile phones & cancer / carcinogenicity • Nuclear power stations & earthquakes
Uncertainty • It is something people deal with in their everyday lives: • Travelling (car / train / air) • Smoking • Betting • Pensions / investments • whether they are aware of it or not • So everyone can understand it….. in some situations
Uncertainty & UK Climate Predictions • There is uncertainty in future climate predictions • CCIRG91, CCIRG96, UKCIP98, UKCIP02, UKCP09 • The first four only provided a single prediction value • (for specific time, place, emissions scenario) • UKCP09 provides a range of values Probability Temperature Increase TemperatureIncrease
UKCP09 - Uncertainty • Uncertainty is useful • But users have to change their workflow to make use of it • The users need to be able to understand the data • UKCIP have done a lot of training on this for users of UKCP09 • They use the analogy of ‘horse race betting’ to explain how the probabilities work • Which people are familiar with Existing Workflow 2.5 1.8, 2.0, 2.1, 2.1, 2.5, 2.6, 2.8
UKCP09 - Projections • UKCP09 data consists of projections of future climate • List of probabilities and values • Need to view the value (e.g. temperature) and the probability distribution to fully understand how accurate the temperature prediction is • Large amount of information to show • So calculate a range instead (90th – 10th percentile) • Can do this visually • but limits on what can be shown Probability Temperature Increase
Representing Uncertainty • Why sound? • Easy – most computers have sound cards • Cheap – only need headphones / speakers • Played relevant sound as mouse moved over map • Asked users to highlight areas above specific threshold • Summer mean daily temperature for each cell • 50th percentile (≈ mean) • Range (≈ uncertainty) • Used Google Maps interface for the evaluation
Results – How does sound help represent uncertainty? • Participants (n = 71) from UEA, OS & UKCIP • Usefulness of sound varied widely • Some found it very helpful, some couldn’t stand it • Knowledge of data set important (p < 0.001) • Using sound to reinforce vision increases scores (p = 0.005) for most • Choosing the correct sonification method is crucial for understanding the data • Only general findings, but there is potential to extend this sonification • to show more data (e.g. the distribution of the probabilities) • or for public engagement
Finnish Town http://kbark.wordpress.com/2006/12/17/where-am-i/ (18/03/2009) Visual Saturation
Results • Compared users results to the correct results • Great variation within results • Cluster C had a very visual learning style • Awareness of data set is important (p < 0.001) • Using sound to reinforce vision increases scores (p = 0.005) for most • Using sound for different variable helps some but not others • Learning Style – Visual learners more effective • Not significant trends: • Subject knowledge • Repeated use