Download
1 / 35
350 likes | 479 Views
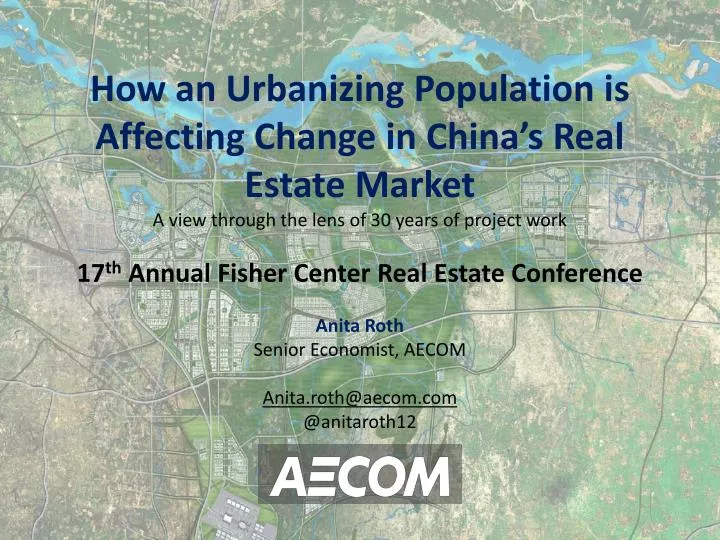
How an Urbanizing Population is Affecting Change in China’s Real Estate Market A view through the lens of 30 years of project work 17 th Annual Fisher Center Real Estate Conference Anita Roth Senior Economist, AECOM Anita.roth@aecom.com @anitaroth12. 1. 2. 3. 4. Introduction.

E N D
How an Urbanizing Population is Affecting Change in China’s Real Estate Market A view through the lens of 30 years of project work 17th Annual Fisher Center Real Estate Conference Anita Roth Senior Economist, AECOM Anita.roth@aecom.com @anitaroth12
1 2 3 4 Introduction Facts & Figures Our Work Development Trends Overview
Cepolina.com Infoseekchina.com
Wildchina.com Thefakechina.com
NASA Earth Observatory Pearl River Delta (1979)
NASA Earth Observatory Pearl River Delta (2003)
China’s population is 4.3 times the size of the U.S.’s 1.4billion ~313 million China (2011) US (2012) Total Population (2011/12)
Population Growth Rate 1.47% China 0.84% 1.13% U.S. 0.52% Population Growth Rate
1.4billion China (2011) China’s Population (2011)
>50% urban Compared with… (690 million) 26% In 1990 Urban Population
in urban areas >1 million 18% (240 million) Compared with… 45% (140 million) In the U.S. Urban Population
GDP Growth Rate 10.4% 3.8% China 3.0% 1.9% U.S. 8.2% Expected in 2012 GDP Growth Rate
$7.3 trillion (US$) China (2011) China’s nominal GDP is 48% that of the U.S.’s $15.1 trillion (US$) US (2011) GDP (nominal)
12% (US$710 billion) Real Estate contribution to GDP Real Estate Market as % of GDP
2 3 4 1 AECOM – Who we are AECOM
Building Engineering Architecture Water Design + Planning Environment Energy Program + Construction Mgmt. Government Services Transportation AECOM – Who we are
>30 years of working on projects in China 2 3 4 1 Working in China
>30 years of working on projects in China 15 years with offices in China 2 3 4 1 Working in China
>30 years of working on projects in China 15 years with offices in China 2 3 4 1 11 offices in China Working in China
>30 years of working on projects in China 15 years with offices in China 2 3 4 1 11 offices in China ~ 4,000 staff in China Working in China
Economic Development Regulatory Political Main Drivers of Development
6 major trends in AECOM’s project work in China* *Disclaimer: None of these trends are really TRUE!
Increase in urban infill projects Increase in tourism-oriented development Increased public sector involvement Increase in demand for economic services Increase in mixed use development Increase in client sophistication Notable Trends
1 Suzhou Region, Jiangsu Province Increase in Urban Infill Projects
2 Increase in Public Sector Involvement
3 Increase in Mixed Use
4 Increase in Client Sophistication
游客市场分析 5 • 接待过夜游客人数 • 过夜外国人游客 Increase in Demand for Economic Services
6 Increase in Tourism-oriented Development
Increase in urban infill projects Increase in tourism-oriented development Increased public sector involvement Increase in demand for economic services Increase in mixed use development Increase in client sophistication Notable Trends
谢谢 Thank you! Anita Roth Senior Economist, AECOM Anita.roth@aecom.com @anitaroth12
$8,382(US$) China (2011) China’s Per capita GDP (PPP) is 17% that of the U.S.’s $48,386 (US$) US (2011) GDP per Capita (PPP)