Download
1 / 22
220 likes | 282 Views
A longitudinal analysis of park equity in Baltimore, MD 1970-2000. Chona Sister Christopher Boone. Global Institute of Sustainability. African-American and high need populations have better walking access to parks, but have access to lower per-capita acres of parks than others

E N D
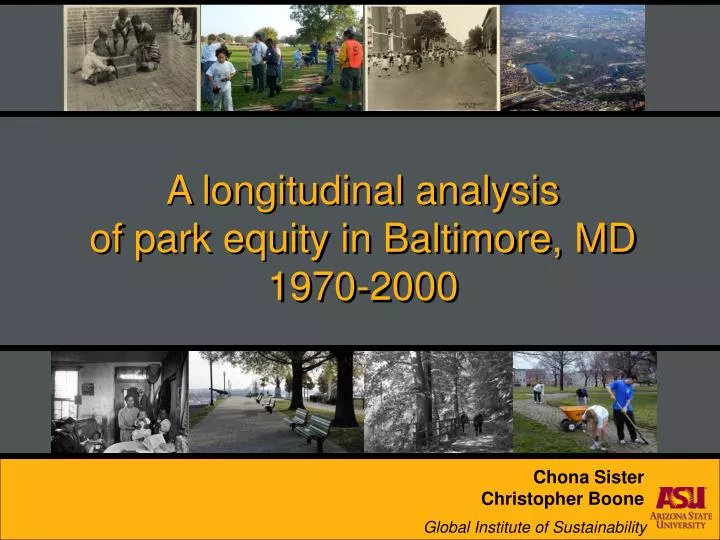
A longitudinal analysisof park equity in Baltimore, MD1970-2000 Chona Sister Christopher Boone Global Institute of Sustainability
African-American and high need populations have better walking access to parks, but have access to lower per-capita acres of parks than others • Current patterns are in spite of a long history of neglecting recreational needs of African-Americans
Hypotheses • Blacks “inherited” much of Baltimore’s space and services from a combination of historic processes • Black neighborhoods grew into formerly white communities better served with parks
Environmental Justice Distributive Outcome equality Distribution of environmental disamenities (and amenities) Participative Process equality Fairness in decision-making, application of law, and institutions Just distributions justly achieved
Comparing present day with historic patterns: 3 methods • Quarter-mile access to parks • Provides a comparison of who have pedestrian access and who do not • Needs-based index • Addresses equity issue; targeting a public good to groups in most need • Potential park congestion • Measures distributional equity without the constraints of a pre-defined service area • 2000 vs. 1970
2000 = 7.9 park acres per 1,000 people 1970 = 5.3 park acres per 1,000 people
Quarter mile access percentage
Park acres per 1K pop across race groups Acres per 1K pop
Needs-based Index: Accessible acres per 1,000 pop Acres per 1K pop
Potential park congestion 1970 2000
Summary • Despite loss of 270,000 people, not significant differences in the equity of park distribution between 1970 and 2000. • For both 1970 and 2000, African-American and high need populations have better walking access to parks, but have access to lower per-capita acres of parks than others