Download
1 / 61
630 likes | 741 Views
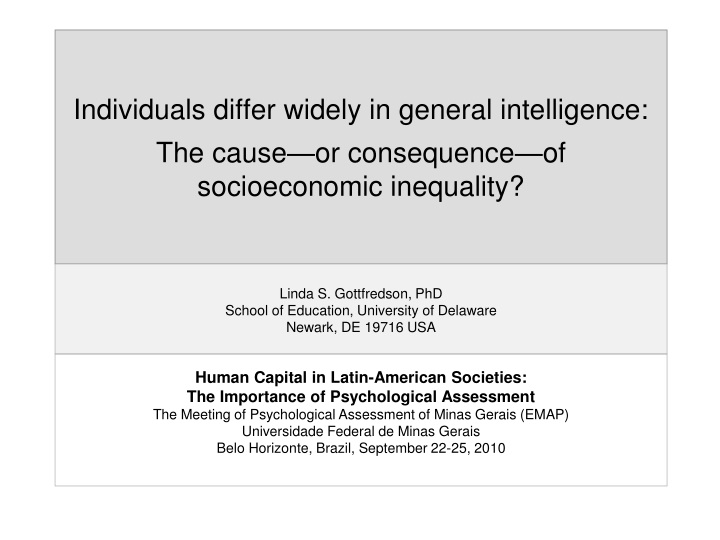
Individuals differ widely in general intelligence: The cause—or consequence—of socioeconomic inequality?. Linda S. Gottfredson, PhD School of Education, University of Delaware Newark, DE 19716 USA. Human Capital in Latin-American Societies: The Importance of Psychological Assessment

E N D
Individuals differ widely in general intelligence: The cause—or consequence—of socioeconomic inequality? Linda S. Gottfredson, PhD School of Education, University of Delaware Newark, DE 19716 USA Human Capital in Latin-American Societies: The Importance of Psychological Assessment The Meeting of Psychological Assessment of Minas Gerais (EMAP) Universidade Federal de Minas Gerais Belo Horizonte, Brazil, September 22-25, 2010
Individuals differ widely in general intelligence: The cause—or consequence—of socioeconomic inequality? Relevance to human capital?? Human Capital in Latin-American Societies: The Importance of Psychological Assessment The Meeting of Psychological Assessment of Minas Gerais (EMAP) Universidade Federal de Minas Gerais Belo Horizonte, Brazil, September 22-25, 2010
Question 1 How much do people differ in general intelligence (g)?
“Intelligence”=cognitive variation g (Age-normed) A fact about populations, not individuals
Cognitive variation= biological fact • Wide spread (like height) • Predictable form (bell curve) • In all times • In all places • In all populations Is constraint in nurturing & exploiting human capital
How does cognitive variation show in behavior? • General ability to: • Learn • Reason • Think abstractly • Spot & solve novel problems • Accumulate & apply knowledge Useful tool—very practical
Sample IQ items (sample stimuli)(individually administered) Infer the rule More abstract Complexity is the active ingredient: More complex tasks are more “g loaded” % = % of 16-65 year-olds getting at least partial credit for answer, WAIS, 1955
Estimated levels of usual cognitive functioning U.S. Dept of Education 1993 National Adult Literacy Survey (NALS) (nationally representative sample, ages 16+, N=26,091) Routinely able to perform tasks only up to this level of difficulty Could teach these individual items, but not all such tasks in daily life
Estimated levels of usual cognitive functioningU.S. Dept of Education 1993 National Adult Literacy Survey (NALS) (nationally representative sample, ages 16+, N=26,091) Routinely able to perform tasks only up to this level of difficulty Additional error to not anticipate others’ errors! So, higher error rates at lower ability levels Could teach these individual items, but not all such tasks in daily life
How do tasks generate errors? Difficulty based on “process complexity” • level of inference • abstractness of info • distracting information Not reading per se, but “reasoning & problem solving”
How do tasks generate errors? Difficulty based on “process complexity” • level of inference • abstractness of info • distracting information Point of cognitive overload, breakdown g ≈ Not reading per se, but “reasoning & problem solving”
Item at NALS Level 1 * 15% (25-39 year-olds) 85% do better • Literal match • One item • Little distracting info 80% probability of correctly answering items of this difficulty level *
Item at NALS Level 2 24% (25-39 year-olds) 15% 61% X • Simple inference • Little distracting information
Item at NALS Level 3 34% (25-39 year-olds) 39% 27% • Cycle through complex table • Irrelevant info
Item at NALS Level 4 22% (25-39 year-olds) 73% 5% Or, Solved • More elements to match • More inferences • More distracting information
Item at NALS Level 5 5% (25-39 year-olds) 95% • Search through complex displays • Multiple distractors • Make high-level text-based inferences • Use specialized knowledge
Question 2 How tight is the link between cognitive variation and social inequality? • pervasive • persisting • worldwide
Correlations differ systematically by outcome Standardized academic achievement .8 Job performance—complex jobs* Years of education .6 Occupational level Job performance—middle-level jobs* .4-.5 Income .3-.4 Delinquency -.25 Job performance—simple jobs* .2 correlation with IQ g * Correlations corrected for attenuation & restriction in range
Life chances at different levels along the IQ continuum X Borderline ability to function asindependent adult Odds of socioeconomic success increase
Life chances at different levels along the IQ continuum X 1 2 3 4 5 NALS levels (25-39 year-olds)
3 thresholds: “trainability” for military NALS 1-2 Military enlistment thresholds 10th 15th 30th X Most military jobs require at least 30th percentile Military policy forbids induction below 15th percentile US law forbids induction below 10th percentile
Life chances at different levels along the IQ continuum X Borderline ability to function asindependent adult
Associated nexus of social problems 7x 8x 4x 70x % of young white adults in 5 IQ ranges having this problem Odds of social problems increase
Large or small, effects are relentless Compound & cumulate Head wind Tail wind
Typical IQ range of applicants Trainability that jobs require Gathers, infers own information Occupational prestige hierarchy College format, independent study Written materials plus job experience Mastery learning, hands-on experience Very explicit, hands-on, no book learning Slow, simple, constant supervision
Question 3 How do different theories explain the link between cognitive & social inequality? • Social privilege theory • Useful tool theory
Competing explanations for pervasive, persisting IQ-SES links • Social privilege theory • IQ differences result mostly from differences in family privilege • Higher IQ and education does not reflect “merit,” but social class in disguise. • Higher level jobs do not require more intelligence to perform well • If everyone had equal opportunities in life, all could perform well and social inequality would disappear. Unequal outcomes signals unequal opportunity to develop & use cognitive talent. Privilege perpetuates itself by pretending to be “merit” • Functional tool theory • IQ differences result mostly from differences in genetic heritage. • Higher g level reflects stronger learning & reasoning ability. • Higher g enhances performance in all jobs, but especially more complex ones. • If everyone had equal opportunities in life, people would perform to very different levels and create social inequality. Equal outcomes would require unequal opportunity to develop & use cognitive talent.
“Social privilege” theory(Using sociologists’ life-cycle model) Health FAMILY ENVIRONMENT & ADVANTAGES Acad Yrs Occ achiev educ level Subjective well-being Observed r Hypothesized r
“Social privilege” theory(Using sociologists’ life-cycle model) Health FAMILY ENVIRONMENT & ADVANTAGES Acad Yrs Occ achiev educ level Subjective well-being Key sources of inequality
“Social privilege” theory(Using sociologists’ life-cycle model) Health FAMILY ENVIRONMENT & ADVANTAGES Acad Yrs Occ achiev educ level Subjective well-being Key sources of inequality
“Social privilege” theory(Using sociologists’ life-cycle model) Health X X FAMILY ENVIRONMENT & ADVANTAGES X X X X X X Acad Yrs Occ achiev educ level Subjective well-being X X Social interventions X Never prevent unequal success
“Social privilege” theory(Using sociologists’ life-cycle model) Health FAMILY ENVIRONMENT & ADVANTAGES Acad Yrs Occ achiev educ level NCLB Subjective well-being NCLB = No Child Left Behind Law Not closing achievement gaps
Competing explanations for pervasive, persisting IQ-SES links Social privilege theory IQ differences result mostly from differences in family privilege Higher IQ and education does not reflect “merit,” but social class in disguise. Higher level jobs do not require more intelligence to perform well If everyone had equal opportunities in life, all could perform well and social inequality would disappear. Unequal outcomes signals unequal opportunity to develop & use cognitive talent. • Useful tool theory • IQ differences result mostly from differences in genetic heritage. • Higher g level reflects stronger learning & reasoning ability. • Higher g enhances performance in all jobs, but especially more complex ones. • If everyone had equal opportunities in life, people would perform to very different levels and create social inequality. Equal outcomes would require unequal opportunity to develop & use cognitive talent. Human cognitive variation guarantees moderate social inequality in any complex, free society
“Useful tool” theory Health Acad Yrs Occ achiev educ level Subjective well-being Key sources of inequality
Recall opposite emphasis of social privilege theory Health Acad Yrs Occ achiev educ level Subjective well-being
“Useful tool” theory: Where’s the practical advantage? Health Acad Yrs Occ achiev educ level Subjective well-being Bigger edge in performance when tasks more complex (“g loaded”)
Question 4 Which explanation is most consistent with the full body of evidence—“social privilege” or “useful tool” theory?
Cognitive variation is highly structured, but not socially constructed Its phenotypic structure appears to be replicated at genetic level g More heritable V Q S M Others
Fluid g rises, then falls with biological ageAll fluid abilities move in tandem IQ 100
Genetic portion of IQ variation rises with ageFamily SES contributions to IQ variation wash away CAUTION: 100% heritable would guarantee both similarity and dissimilarity of parents & offspring heritability environmentality (shared type) CAUTION: Family background still matters for other outcomes, but notg
Behavior genetic evidence on IQ-SES link % heritable: 60-70 50 40-50 % jointly with IQ: Health Acad Yrs Occ achiev educ level Subjective well-being
Behavior genetic evidence on IQ-SES link % heritable: 60-70 50 40-50 % jointly with IQ: 40 25 20 Health Acad Yrs Occ achiev educ level Subjective well-being Caution: “Controlling” for education, occupation & income removes valid variance in g—much of it genetic
predictive validity of g A “g” hierarchy among jobs Duties that correlate with job complexity .8 .5 .2
Duties that correlate with job complexity .8 .5 .2 Cannot flatten the occupational hierarchy Cannot negate practical value of higher g Therefore cannot equalize socioeconomic outcomes
Task performance evidence on the IQ-SES link Health Acad Yrs Occ achiev educ level Subjective well-being • g predicts performance in all task domains • Correlationshigher when tasks more complex • AND • There is no substitute for effective learning & reasoning
Implications for human cognitive capital? #1 Work within the constraints imposed by human variation