Download
1 / 1
10 likes | 133 Views
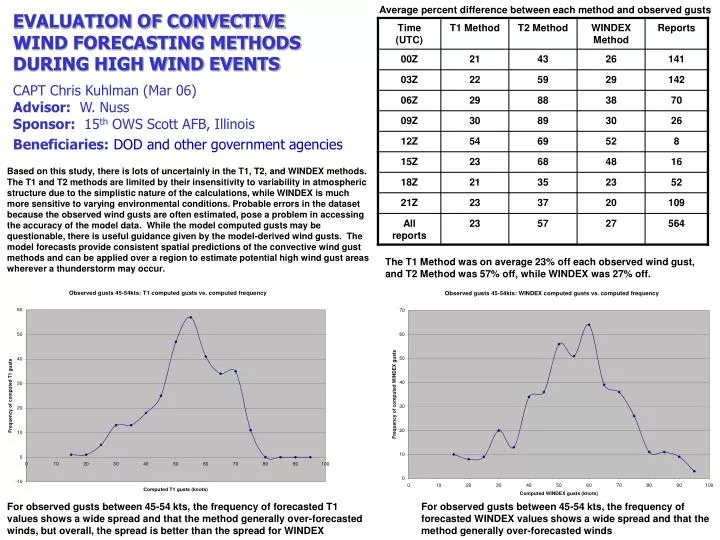
Average percent difference between each method and observed gusts. EVALUATION OF CONVECTIVE WIND FORECASTING METHODS DURING HIGH WIND EVENTS. CAPT Chris Kuhlman (Mar 06) Advisor: W. Nuss Sponsor: 15 th OWS Scott AFB, Illinois Beneficiaries: DOD and other government agencies.

E N D
Average percent difference between each method and observed gusts EVALUATION OF CONVECTIVE WIND FORECASTING METHODS DURING HIGH WIND EVENTS CAPT Chris Kuhlman (Mar 06)Advisor: W. NussSponsor: 15th OWS Scott AFB, Illinois Beneficiaries:DOD and other government agencies Based on this study, there is lots of uncertainly in the T1, T2, and WINDEX methods. The T1 and T2 methods are limited by their insensitivity to variability in atmospheric structure due to the simplistic nature of the calculations, while WINDEX is much more sensitive to varying environmental conditions. Probable errors in the dataset because the observed wind gusts are often estimated, pose a problem in accessing the accuracy of the model data. While the model computed gusts may be questionable, there is useful guidance given by the model-derived wind gusts. The model forecasts provide consistent spatial predictions of the convective wind gust methods and can be applied over a region to estimate potential high wind gust areas wherever a thunderstorm may occur. The T1 Method was on average 23% off each observed wind gust, and T2 Method was 57% off, while WINDEX was 27% off. For observed gusts between 45-54 kts, the frequency of forecasted T1 values shows a wide spread and that the method generally over-forecasted winds, but overall, the spread is better than the spread for WINDEX For observed gusts between 45-54 kts, the frequency of forecasted WINDEX values shows a wide spread and that the method generally over-forecasted winds