Download
1 / 32
320 likes | 459 Views
Paired Data: One Quantitative Variable. Chapter 7. Introduction. The paired datasets in this chapter have one pair of quantitative response values for each observational unit . This allows for a built-in comparison .

E N D
Paired Data: One Quantitative Variable Chapter 7
Introduction • The paired datasets in this chapter have one pair of quantitative response values for each observational unit. • This allows for a built-in comparison. • Studies with paired data remove individual variability by looking at the difference score for each individual. • Reducing variability in data improves inferences: • Narrower confidence intervals • Smaller p-values when the null hypothesis is false
Introduction • Our data that we will analyze will just be a single quantitative variable. • So things like mean and standard deviation are important to look at, but really nothing new for descriptive statistics. • Section 7.1: Simulation-based method • Section 7.2: Theory-based method
Section 7.1: Simulation-Based Approach for Analyzing Paired Data Example 7.1: Rounding First Base
First Base • Imagine you’ve hit a line drive and are trying to reach second base. • Does the path that you take to “round” first base make much a difference? • Narrow angle • Wide angle
First Base • Hollander and Wolfe (1999) report on a Master’s Thesis by Woodward (1970) that investigates base running strategies. • Woodward timed 22 different runners from a spot 35 feet past home to a spot 15 feet before second. • Each runner used each strategy (paired design), with a rest between. • This paired design controls for the runner-to-runner variability. • He used random assignment to decide which path each runner should do first.
First Base • Times for the first 10 runners • Dotplots of times for all 22 runners
First Base • There is a lot of overlap in the distributions and a fair bit of variability • Difficult to detect a difference between the methods when there’s a lot of variation
First Base • What are the observational units in this study? • The runners (22 total) • What variables are recorded? What are their types and roles? • Explanatory variable: base running method: wide or narrow angle (categorical) • Response variable: time for middle of the route from home plate to second base (quantitative) • Is this an observational study or an experiment? • Randomized experiment since the explanatory variable was randomly applied to determined which method each runner used first
First Base • These data are clearly paired. • The paired response variable is time difference in running between the two methods (narrow angle – wide angle). • Could we do wide angle – narrow angle?
First Base • Differences for the first 10 runners • A dotplot of the differences for all 22 runners.
First Base • The distribution is a bit skewed left, but not too bad. • Mean difference is d = 0.075 seconds • Standard deviation is SDd= 0.0883 sec • Standard deviation (0.0883) is smaller than the original standard deviations of the running times (0.260 and 0.273).
First Base • The original dotplotswith each observation paired between the base running strategies. • What do you notice?
First Base • Is the average difference of d = 0.075 seconds significantly different from 0? • The parameter of interest is, µd, is the population average difference in running times by some population of runners when using the narrow angle and the wide angle. (narrow – wide)
First Base The hypotheses: • H0: µd = 0 • On average, the mean of the differences between the running times (narrow – wide) is 0. • Ha: µd 0 • On average, the mean of the differences in running times (narrow – wide) is not 0. • If the parameter of interest is the population average difference, then the corresponding statistic is the sample average difference.
First Base • How can simulation-based methods find an approximate p-value? • The null basically says the running path doesn’t matter --- the times, on average, will be the same for the two methods. • So we can use our same data set and randomly decide which time goes with the narrow and wide methods and compute a mean difference. (Notice we don’t break our pairs.) • We can repeat this process many times to develop a null distribution.
First Base • The results of random swaps for the first 10 runners (done with coin flips) • An average difference of d = -0.025 seconds • Repeat many times to construct a null distribution • This models no connection between times and the strategy used
First Base • Mean differences from 1000 repetitions • Describe the shape of the distribution. • The distribution appears to be centered at about 0. Does that make sense?
First Base • Using the null distribution is the observed average from the study of 0.075 out in the tail?
First Base • Only 2 of the 1000 repetitions of random swappingsgave a value at least as extreme as 0.075
First Base • We can also standardize 0.075 by dividing by the applet’s estimate of the SD ≈ 0.024 to see we are standard deviations above zero.
First Base • Based on the p-value and standardized statistic we have very strong evidence against the null hypothesis. • We can draw a cause-and-effect conclusions since the researcher used random assignment of the two base running methods for each runner. • There was not a lot of information about how these 22 runners were selected to decide if we can generalize to a larger population.
First Base • Approximate a 95% confidence interval for d: • 0.075 ± 2(0.024) seconds • (0.027, 0.124) seconds • What does this mean? • We are 95% confident that, on average, the narrow angle route takes 0.027 to 0.124 seconds longer than the wide angle route • Let’s try this out with the applet.
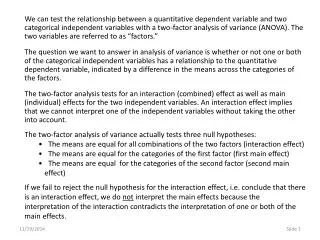
First Base Alternative Analysis • What do you think would happen if we wrongly analyzed the data using a 2 independent samples procedure? • I.e. the researcher selected 22 runners to use the wide method and an independent sample of 22 other runners to use the narrow method, obtaining the same 44 times as in the actual study. • Would the p-value stay the same, increase, or decrease?
First Base Using the Two Means applet (which does an independent test) we get a p-value of 0.1830 Does it make sense that this p-value is larger than the one we obtained earlier?
Exercise and Heart Rate Exploration 7.1
Section 7.2: Theory-based methods for paired data. H0: µd = 0 • Path doesn’t matter • Ha: µd 0 • Path does matter narrow - wide • d = 0.075 seconds • SDd= 0.0883 seconds • n = 22
First Base • Our null distribution was centered at zero and fairly bell-shaped. • This can all be predicted (along with the variability) using theory-based methods. To do this, our sample size should be at least 20.
Theory-based test • We can do theory-based methods with the applet we used last time or the theory-based applet. • With the applet we used last time, we need to calculate the t-statistic: • With the theory-based applet, we just need to enter the summary statistics and use a test for a one mean.
First Base • The theory-based model gives slightly different results, but we come to the same conclusion. Which base running path used does make a difference in the average times (we can see that with our small p-value). • We estimate the narrow angle path will take between 0.036 to 0.114 seconds longer, on average, to complete than the wide angle path.
Exploration 7.2Comparing Auction Formats • We will compare: • Dutch auction the item for sale starts at a very high price and is lowered gradually until someone finds the price low enough to buy. • First-price sealed bid auction each bidder summits a single sealed bid before a particular deadline. After the deadline, the person with the highest bid wins.