Download

1 / 13
130 likes | 251 Views
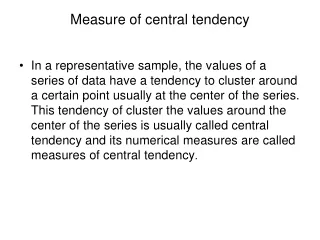
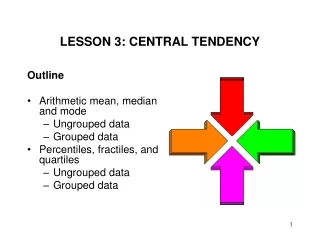
Measure of Central Tendency Lesson 1 (5 th 6 Weeks) TEKS 6.10B. Range. The difference between the greatest and least numbers in a set of data EX: 89, 82, 79, 74, 69, 67, 58, 56, 54. 89 is the greatest number. 54 is the least number. Their difference is 89-54 or 35.

E N D
Range • The difference between the greatest and least numbers in a set of data • EX: 89, 82, 79, 74, 69, 67, 58, 56, 54 89 is the greatest number 54 is the least number Their difference is 89-54 or 35. The range of this data is 35.
Median • Middle number of a set of data, when the numbers are in numerical order. If there are two middle numbers, the mean (average) of the two numbers is the median.
Examples: • Ex: 115, 108, 101, 92, 84, 84, 62 • Ex: 3, 8, 12, 35, 45, 61, 78, 81 92 is in the middle & is the median. There are two middle numbers, 35 & 45. Find the number halfway between 35 & 45.
4 0 35 + 45 2 80 -8 80 0 40 is the middle number or the median of this set of data.
Mode • Number that occurs mostoften in a set of data • EX: 45, 450, 450, 465, 465, 465, 470 465 occurs the most & is the mode
Mean • An average of the values in a set of data • Useful when there are no outliers • If the values of a group of data is evenedout so all the values are the same, the evened-out number is the mean
Another procedure to find the mean is to divide the sum of the values by the number of values in the set (add & divide) • EX: 4 + 7 + 3 + 4 + 13 + 3 + 7 + 13 = 54 ÷ 8 = the mean is 54 6.75 6.75
Example: • Lisbeth scores for her last mini-assessment are listed below. Find the range, median, mode and mean of her last mini-assessment scores. 85, 90, 95, 80, 73, 72, 100, 80 • First things first, let’s place the scores in order from least to greatest.
72, 73, 80, 80, 85, 90, 95, 100 9 10 • Range: • Median: 100 Range is 28 - 72 28 72, 73, 80, 80, 85, 90, 95, 100 80 & 85 are both in the middle. We need to add & divide.
72, 73, 80, 80, 85, 90, 95, 100 80 8 2 . 5 + 85 2 165 0 The median is 82.5. -16 165 0 5 - 4 1 0 -10 0
72, 73, 80, 80, 85, 90, 95, 100 • Mode: The number we see the most is 80. So the mode is 80.
72, 73, 80, 80, 85, 90, 95, 100 1 8 4 . 3 7 5 • Mean 72 8 675 0 0 0 73 -64 80 3 5 80 -32 85 The mean is 84.375. 3 0 90 -24 95 + 100 6 0 67 5 -56 4 0 -40 0