Download
1 / 46
470 likes | 607 Views
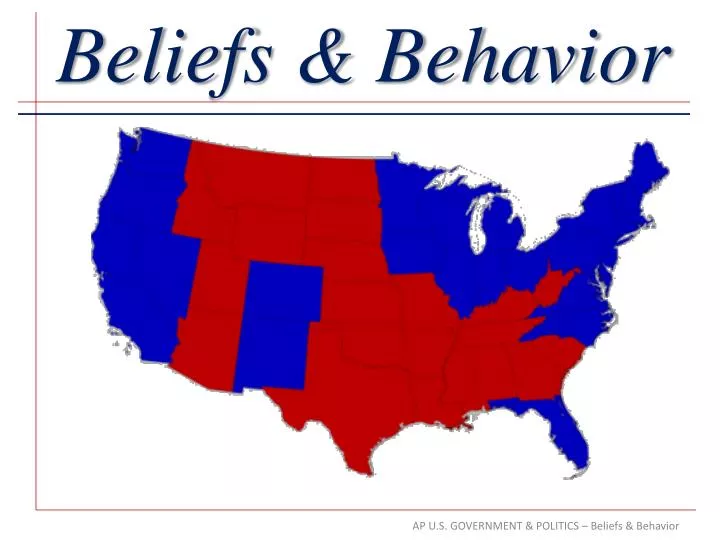
Beliefs & Behavior. Which Political Party?. Ideology?. Same Ideology as Parents?. Approve of job Obama is doing?. Will Obama win re-election?. Direction of the country?. Approve of Bush the Younger?. Gun control laws?. Deny citizenship to U.S. born children of illegal immigrants?.

E N D
Beliefs & Behavior AP U.S. GOVERNMENT & POLITICS – Beliefs & Behavior
Which Political Party? AP U.S. GOVERNMENT & POLITICS – Beliefs & Behavior
Ideology? AP U.S. GOVERNMENT & POLITICS – Beliefs & Behavior
Same Ideology as Parents? AP U.S. GOVERNMENT & POLITICS – Beliefs & Behavior
Approve of job Obama is doing? AP U.S. GOVERNMENT & POLITICS – Beliefs & Behavior
Will Obama win re-election? AP U.S. GOVERNMENT & POLITICS – Beliefs & Behavior
Direction of the country? AP U.S. GOVERNMENT & POLITICS – Beliefs & Behavior
Approve of Bush the Younger? AP U.S. GOVERNMENT & POLITICS – Beliefs & Behavior
Gun control laws? AP U.S. GOVERNMENT & POLITICS – Beliefs & Behavior
Deny citizenship to U.S. born children of illegal immigrants? AP U.S. GOVERNMENT & POLITICS – Beliefs & Behavior
Opinion of Sarah Palin? AP U.S. GOVERNMENT & POLITICS – Beliefs & Behavior
Regulate greenhouse gases? AP U.S. GOVERNMENT & POLITICS – Beliefs & Behavior
Gone to war with Iraq? AP U.S. GOVERNMENT & POLITICS – Beliefs & Behavior
Cal raise taxes for CSU/UC? AP U.S. GOVERNMENT & POLITICS – Beliefs & Behavior
Fed raise taxes on upper income for college grants? AP U.S. GOVERNMENT & POLITICS – Beliefs & Behavior
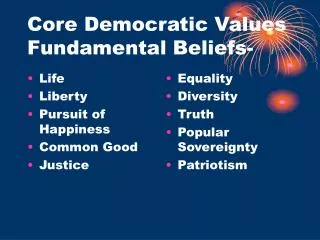
Political Culture • An overall set of values widely shared • within a society • Core Values of U.S. Political Culture • Legal & political equality • NOT economic equality • Freedoms . . . Religion, Speech Political Beliefs AP U.S. GOVERNMENT & POLITICS – Beliefs & Behavior
Political Socialization • Process through which people acquire • political beliefs as they grow up Political Beliefs AP U.S. GOVERNMENT & POLITICS – Beliefs & Behavior
Political values passed to next generation Most important role is played by . . . The Family Process of Political Socialization
Political values passed to next generation Most important role is played by . . . The Family Process of Political Socialization
Other influences include . . . Process of Political Socialization AP U.S. GOVERNMENT & POLITICS – Beliefs & Behavior
Political Efficacy • Belief that one can make a difference in • politics by expressing an opinion and • acting politically • If one believes s/he can make a difference, • will be more likely to act Political Behavior AP U.S. GOVERNMENT & POLITICS – Beliefs & Behavior
Forms of Political Participation • Most common is • VOTING Political Behavior AP U.S. GOVERNMENT & POLITICS – Beliefs & Behavior
Forms of Political Participation • Other forms include: • - signing petitions • - attending meetings • - contacting politicians • - donating money to campaigns Political Behavior AP U.S. GOVERNMENT & POLITICS – Beliefs & Behavior
Political Behavior AP U.S. GOVERNMENT & POLITICS – Beliefs & Behavior
Who Votes? • Majority does NOT vote in most elections ! • Lower voter turnout in primaries • (compared to general elections) • Those with strong party identification • vote more regularly Voting Behavior AP U.S. GOVERNMENT & POLITICS – Beliefs & Behavior
Who Votes? • College grads more likely to vote than • people with High School diploma • Young are less likely to vote • When 18 year olds got the right to vote • in 1971 . . . had lowest turnout rate in • 1972 presidential elections Voting Behavior AP U.S. GOVERNMENT & POLITICS – Beliefs & Behavior
Voting Behavior AP U.S. GOVERNMENT & POLITICS – Beliefs & Behavior
Some reasons for low voter turnout • * Registration requirements • * Weak party affiliation • * Weekday elections • * Frequency of elections • (too many, especially state & local) Voting Behavior AP U.S. GOVERNMENT & POLITICS – Beliefs & Behavior
During the Kennedy & Johnson administrations, • the average percentage of people saying they “always” or “most of the time” trust the government to do what is right . . . • 40% • 68% • 29% • 37% Trust in Government AP U.S. GOVERNMENT & POLITICS – Beliefs & Behavior
During the Kennedy & Johnson administrations, • the average percentage of people saying they “always” or “most of the time” trust the government to do what is right . . . • 68% Trust in Government AP U.S. GOVERNMENT & POLITICS – Beliefs & Behavior
During the Nixon & Ford administrations, • the average percentage of people saying they “always” or “most of the time” trust the government to do what is right . . . • 40% • 36% • 29% • 55% Trust in Government AP U.S. GOVERNMENT & POLITICS – Beliefs & Behavior
During the Nixon & Ford administrations, • the average percentage of people saying they “always” or “most of the time” trust the government to do what is right . . . • 40% Trust in Government AP U.S. GOVERNMENT & POLITICS – Beliefs & Behavior
During the Carter administration, • the average percentage of people saying they “always” or “most of the time” trust the government to do what is right . . . • 46% • 35% • 29% • 51% Trust in Government AP U.S. GOVERNMENT & POLITICS – Beliefs & Behavior
During the Carter administration, • the average percentage of people saying they “always” or “most of the time” trust the government to do what is right . . . • 29% Trust in Government AP U.S. GOVERNMENT & POLITICS – Beliefs & Behavior
During the Reagan administration, • the average percentage of people saying they “always” or “most of the time” trust the government to do what is right . . . • 64% • 52% • 38% • 42% Trust in Government AP U.S. GOVERNMENT & POLITICS – Beliefs & Behavior
During the Reagan administration, • the average percentage of people saying they “always” or “most of the time” trust the government to do what is right . . . • 42% Trust in Government AP U.S. GOVERNMENT & POLITICS – Beliefs & Behavior
During the Bush I administration, • the average percentage of people saying they “always” or “most of the time” trust the government to do what is right . . . • 25% • 36% • 44% • 50% Trust in Government AP U.S. GOVERNMENT & POLITICS – Beliefs & Behavior
During the Bush I administration, • the average percentage of people saying they “always” or “most of the time” trust the government to do what is right . . . • 36% Trust in Government AP U.S. GOVERNMENT & POLITICS – Beliefs & Behavior
During the Clinton administration, • the average percentage of people saying they “always” or “most of the time” trust the government to do what is right . . . • 48% • 37% • 29% • 18% Trust in Government AP U.S. GOVERNMENT & POLITICS – Beliefs & Behavior
During the Clinton administration, • the average percentage of people saying they “always” or “most of the time” trust the government to do what is right . . . • 29% Trust in Government AP U.S. GOVERNMENT & POLITICS – Beliefs & Behavior
During the Bush II administration, • the average percentage of people saying they “always” or “most of the time” trust the government to do what is right . . . • 16% • 24% • 37% • 43% Trust in Government AP U.S. GOVERNMENT & POLITICS – Beliefs & Behavior
During the Bush II administration, • the average percentage of people saying they “always” or “most of the time” trust the government to do what is right . . . • 37% Trust in Government AP U.S. GOVERNMENT & POLITICS – Beliefs & Behavior
During the Obama administration, • the average percentage of people saying they “always” or “most of the time” trust the government to do what is right . . . • 15% • 22% • 35% • 48% Trust in Government AP U.S. GOVERNMENT & POLITICS – Beliefs & Behavior
During the Obama administration, • the average percentage of people saying they “always” or “most of the time” trust the government to do what is right . . . • 22% Trust in Government AP U.S. GOVERNMENT & POLITICS – Beliefs & Behavior
Trust in Government AP U.S. GOVERNMENT & POLITICS – Beliefs & Behavior
Read 2 articles • Question: • Are today’s young people cynics or idealists? • How will this affect politics & government in the near future? Discuss & explain. Assignment AP U.S. GOVERNMENT & POLITICS – Beliefs & Behavior