Download
1 / 1
10 likes | 31 Views
Axis Direct presents daily derivatives report presenting recommendations based on technical analysis. For trading in derivatives visit https://simplehai.axisdirect.in/offerings/products/derivatives<br>https://simplehai.axisdirect.in/share-stock-prices/nse/Ashok-Leyland-Ltd-31<br>https://simplehai.axisdirect.in/share-stock-prices/nse/Housing-Development-Finance-Corporation-Ltd-230<br>

E N D
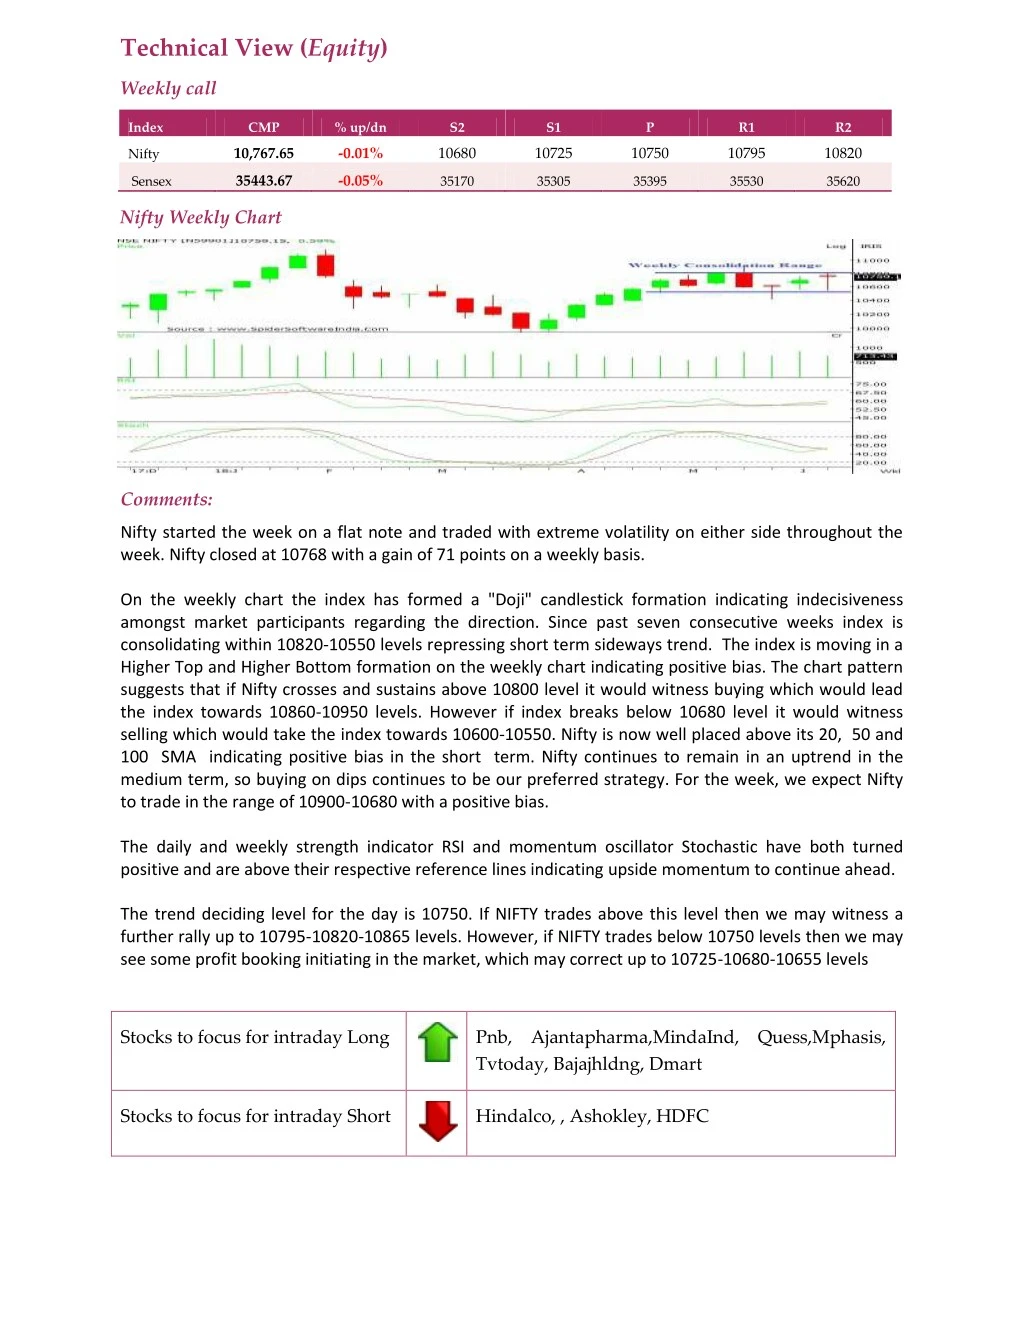
Technical View (Equity) Weekly call Index CMP % up/dn S2 S1 P R1 R2 10,767.65 -0.01% 10680 10725 10750 10795 10820 Nifty 35443.67 -0.05% Sensex 35170 35305 35395 35530 35620 Nifty Weekly Chart Comments: Nifty started the week on a flat note and traded with extreme volatility on either side throughout the week. Nifty closed at 10768 with a gain of 71 points on a weekly basis. On the weekly chart the index has formed a "Doji" candlestick formation indicating indecisiveness amongst market participants regarding the direction. Since past seven consecutive weeks index is consolidating within 10820-10550 levels repressing short term sideways trend. The index is moving in a Higher Top and Higher Bottom formation on the weekly chart indicating positive bias. The chart pattern suggests that if Nifty crosses and sustains above 10800 level it would witness buying which would lead the index towards 10860-10950 levels. However if index breaks below 10680 level it would witness selling which would take the index towards 10600-10550. Nifty is now well placed above its 20, 50 and 100 SMA indicating positive bias in the short term. Nifty continues to remain in an uptrend in the medium term, so buying on dips continues to be our preferred strategy. For the week, we expect Nifty to trade in the range of 10900-10680 with a positive bias. The daily and weekly strength indicator RSI and momentum oscillator Stochastic have both turned positive and are above their respective reference lines indicating upside momentum to continue ahead. The trend deciding level for the day is 10750. If NIFTY trades above this level then we may witness a further rally up to 10795-10820-10865 levels. However, if NIFTY trades below 10750 levels then we may see some profit booking initiating in the market, which may correct up to 10725-10680-10655 levels Stocks to focus for intraday Long Pnb, Ajantapharma,MindaInd, Quess,Mphasis, Tvtoday, Bajajhldng, Dmart Stocks to focus for intraday Short Hindalco, , Ashokley, HDFC