Download
1 / 1
10 likes | 26 Views
Axis Direct presents daily derivatives report presenting recommendations based on technical analysis. For trading in derivatives visit https://simplehai.axisdirect.in/offerings/products/derivatives<br>https://simplehai.axisdirect.in/share-stock-prices/nse/Bharat-Petroleum-Corporation-Ltd-2290<br>https://simplehai.axisdirect.in/share-stock-prices/nse/Tata-Consultancy-Services-Ltd-5400<br>https://simplehai.axisdirect.in/share-stock-prices/nse/Just-Dial-Ltd-41369<br>

E N D
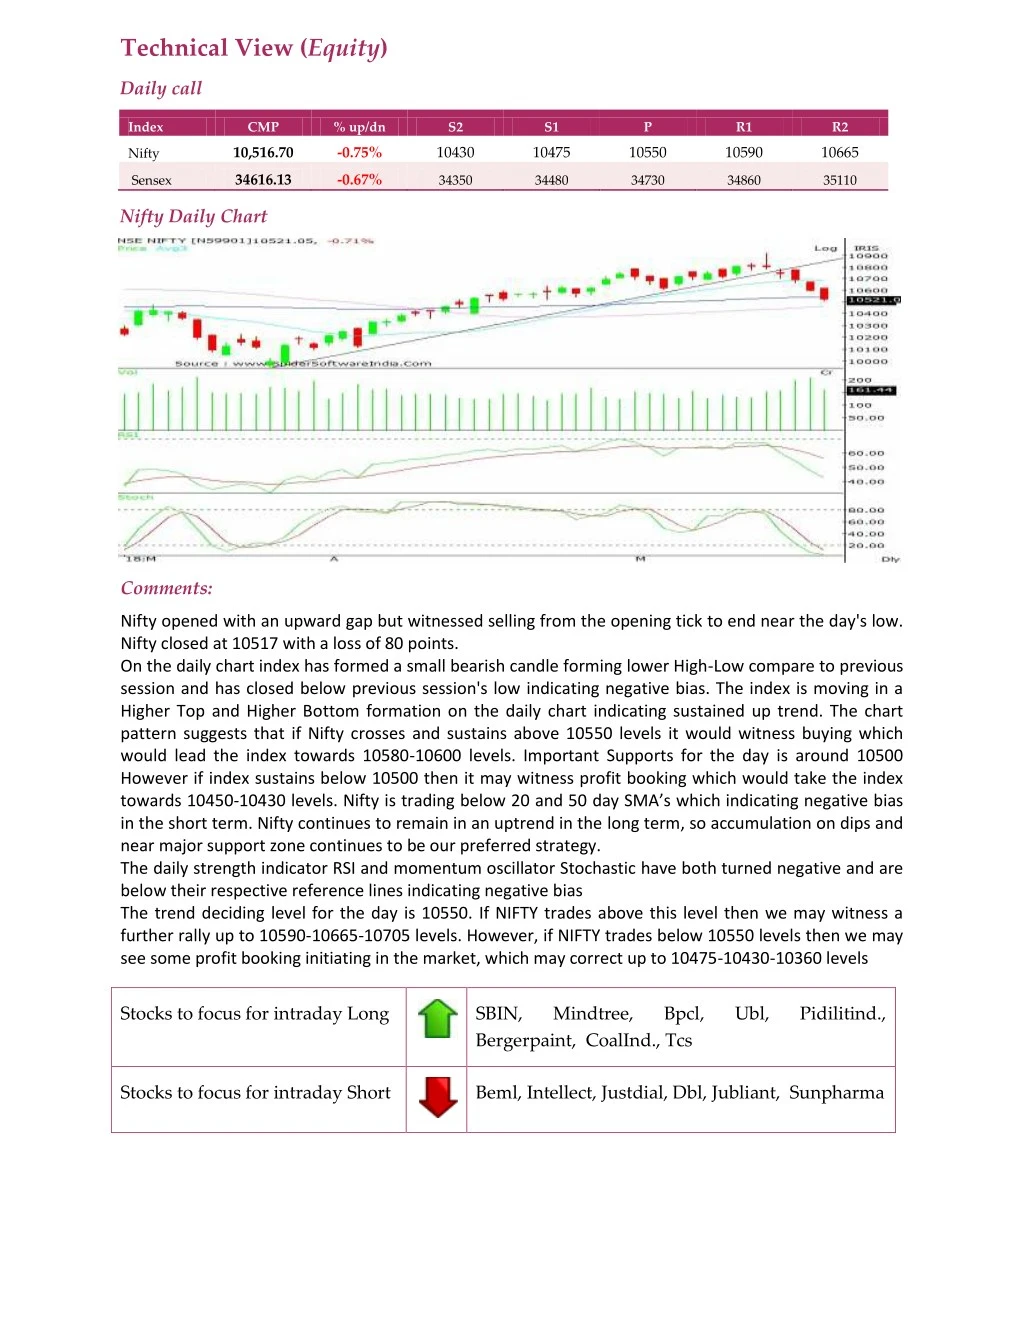
Technical View (Equity) Daily call Index CMP % up/dn S2 S1 P R1 R2 10,516.70 -0.75% 10430 10475 10550 10590 10665 Nifty 34616.13 -0.67% Sensex 34350 34480 34730 34860 35110 Nifty Daily Chart Comments: Nifty opened with an upward gap but witnessed selling from the opening tick to end near the day's low. Nifty closed at 10517 with a loss of 80 points. On the daily chart index has formed a small bearish candle forming lower High-Low compare to previous session and has closed below previous session's low indicating negative bias. The index is moving in a Higher Top and Higher Bottom formation on the daily chart indicating sustained up trend. The chart pattern suggests that if Nifty crosses and sustains above 10550 levels it would witness buying which would lead the index towards 10580-10600 levels. Important Supports for the day is around 10500 However if index sustains below 10500 then it may witness profit booking which would take the index towards 10450-10430 levels. Nifty is trading below 20 and 50 day SMA’s which indicating negative bias in the short term. Nifty continues to remain in an uptrend in the long term, so accumulation on dips and near major support zone continues to be our preferred strategy. The daily strength indicator RSI and momentum oscillator Stochastic have both turned negative and are below their respective reference lines indicating negative bias The trend deciding level for the day is 10550. If NIFTY trades above this level then we may witness a further rally up to 10590-10665-10705 levels. However, if NIFTY trades below 10550 levels then we may see some profit booking initiating in the market, which may correct up to 10475-10430-10360 levels Stocks to focus for intraday Long SBIN, Bergerpaint, CoalInd., Tcs Mindtree, Bpcl, Ubl, Pidilitind., Stocks to focus for intraday Short Beml, Intellect, Justdial, Dbl, Jubliant, Sunpharma


![Full{90k} W.a.t.c.h ("Samson") [2018] Movie {Online Free}"HD"](https://cdn4.slideserve.com/7787773/full-90k-w-a-t-c-h-samson-2018-movie-online-free-dt.jpg)