Download
1 / 1
10 likes | 21 Views
Axis Direct presents daily derivatives report presenting recommendations based on technical analysis. For trading in derivatives visit https://simplehai.axisdirect.in/offerings/products/derivatives<br>https://simplehai.axisdirect.in/share-stock-prices/nse/Jet-Airways-(India)-Ltd-5586<br>

E N D
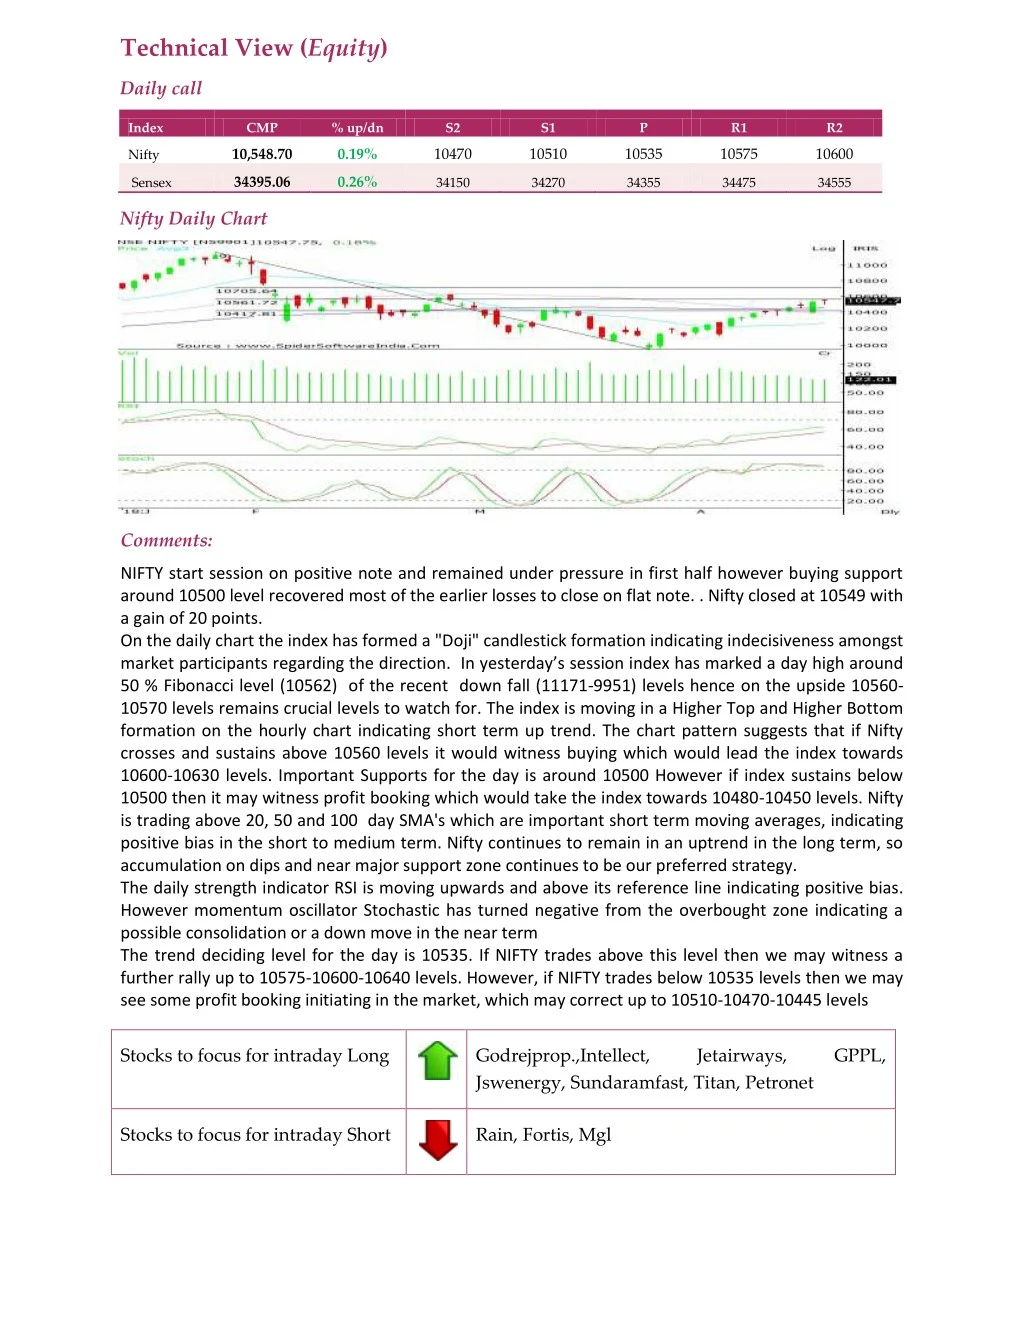
Technical View (Equity) Daily call Index CMP % up/dn S2 S1 P R1 R2 10,548.70 0.19% 10470 10510 10535 10575 10600 Nifty 34395.06 0.26% Sensex 34150 34270 34355 34475 34555 Nifty Daily Chart Comments: NIFTY start session on positive note and remained under pressure in first half however buying support around 10500 level recovered most of the earlier losses to close on flat note. . Nifty closed at 10549 with a gain of 20 points. On the daily chart the index has formed a "Doji" candlestick formation indicating indecisiveness amongst market participants regarding the direction. In yesterday’s session index has marked a day high around 50 % Fibonacci level (10562) of the recent down fall (11171-9951) levels hence on the upside 10560- 10570 levels remains crucial levels to watch for. The index is moving in a Higher Top and Higher Bottom formation on the hourly chart indicating short term up trend. The chart pattern suggests that if Nifty crosses and sustains above 10560 levels it would witness buying which would lead the index towards 10600-10630 levels. Important Supports for the day is around 10500 However if index sustains below 10500 then it may witness profit booking which would take the index towards 10480-10450 levels. Nifty is trading above 20, 50 and 100 day SMA's which are important short term moving averages, indicating positive bias in the short to medium term. Nifty continues to remain in an uptrend in the long term, so accumulation on dips and near major support zone continues to be our preferred strategy. The daily strength indicator RSI is moving upwards and above its reference line indicating positive bias. However momentum oscillator Stochastic has turned negative from the overbought zone indicating a possible consolidation or a down move in the near term The trend deciding level for the day is 10535. If NIFTY trades above this level then we may witness a further rally up to 10575-10600-10640 levels. However, if NIFTY trades below 10535 levels then we may see some profit booking initiating in the market, which may correct up to 10510-10470-10445 levels Stocks to focus for intraday Long Godrejprop.,Intellect, Jswenergy, Sundaramfast, Titan, Petronet Jetairways, GPPL, Stocks to focus for intraday Short Rain, Fortis, Mgl
