Download
1 / 1
10 likes | 23 Views
Axis Direct presents daily derivatives report presenting recommendations based on technical analysis. For trading in derivatives visit https://simplehai.axisdirect.in/offerings/products/derivatives<br>https://simplehai.axisdirect.in/share-stock-prices/nse/State-Bank-of-India-1375<br>https://simplehai.axisdirect.in/share-stock-prices/nse/Ashok-Leyland-Ltd-31<br>https://simplehai.axisdirect.in/share-stock-prices/nse/Sun-Pharmaceuticals-Industries-Ltd-4325<br>

E N D
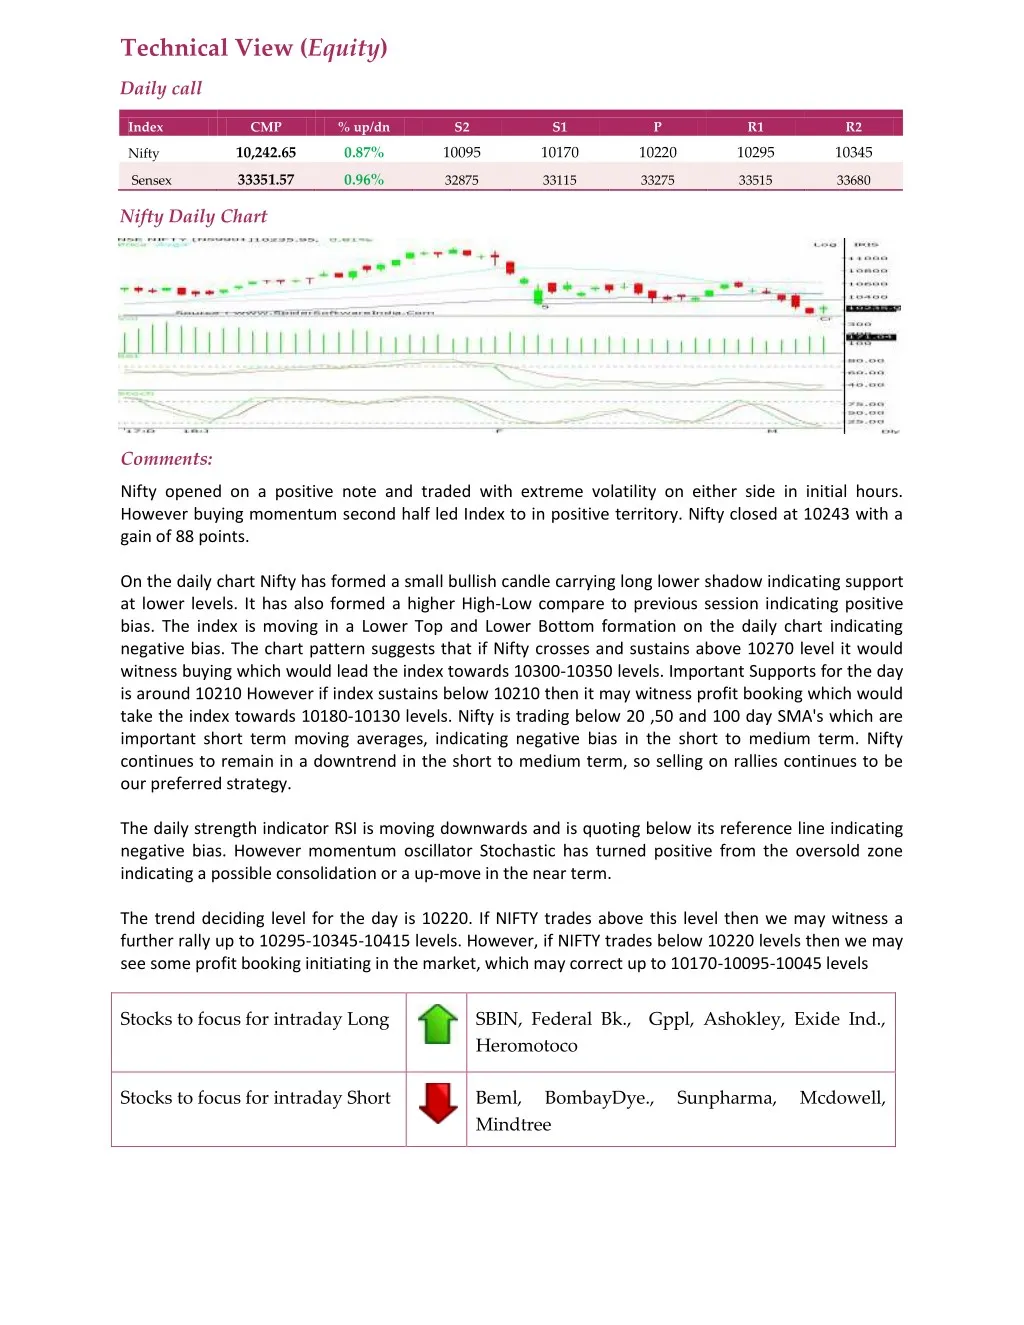
Technical View (Equity) Daily call Index CMP % up/dn S2 S1 P R1 R2 10,242.65 0.87% 10095 10170 10220 10295 10345 Nifty 33351.57 0.96% Sensex 32875 33115 33275 33515 33680 Nifty Daily Chart Comments: Nifty opened on a positive note and traded with extreme volatility on either side in initial hours. However buying momentum second half led Index to in positive territory. Nifty closed at 10243 with a gain of 88 points. On the daily chart Nifty has formed a small bullish candle carrying long lower shadow indicating support at lower levels. It has also formed a higher High-Low compare to previous session indicating positive bias. The index is moving in a Lower Top and Lower Bottom formation on the daily chart indicating negative bias. The chart pattern suggests that if Nifty crosses and sustains above 10270 level it would witness buying which would lead the index towards 10300-10350 levels. Important Supports for the day is around 10210 However if index sustains below 10210 then it may witness profit booking which would take the index towards 10180-10130 levels. Nifty is trading below 20 ,50 and 100 day SMA's which are important short term moving averages, indicating negative bias in the short to medium term. Nifty continues to remain in a downtrend in the short to medium term, so selling on rallies continues to be our preferred strategy. The daily strength indicator RSI is moving downwards and is quoting below its reference line indicating negative bias. However momentum oscillator Stochastic has turned positive from the oversold zone indicating a possible consolidation or a up-move in the near term. The trend deciding level for the day is 10220. If NIFTY trades above this level then we may witness a further rally up to 10295-10345-10415 levels. However, if NIFTY trades below 10220 levels then we may see some profit booking initiating in the market, which may correct up to 10170-10095-10045 levels Stocks to focus for intraday Long SBIN, Federal Bk., Gppl, Ashokley, Exide Ind., Heromotoco Stocks to focus for intraday Short Beml, Mindtree BombayDye., Sunpharma, Mcdowell,