Download
1 / 1
10 likes | 27 Views
Axis Direct presents daily derivatives report presenting recommendations based on technical analysis. For trading in derivatives visit https://simplehai.axisdirect.in/offerings/products/derivatives<br>https://simplehai.axisdirect.in/share-stock-prices/nse/Lupin-Ltd-3026<br>https://simplehai.axisdirect.in/share-stock-prices/nse/Aurobindo-Pharma-Ltd-4666<br>https://simplehai.axisdirect.in/share-stock-prices/nse/Asian-Paints-Ltd-34<br>https://simplehai.axisdirect.in/share-stock-prices/nse/HDFC-Bank-Ltd-4987<br>https://simplehai.axisdirect.in/share-stock-prices/nse/Kotak-Mahindra-Bank-Ltd-2330<br>

E N D
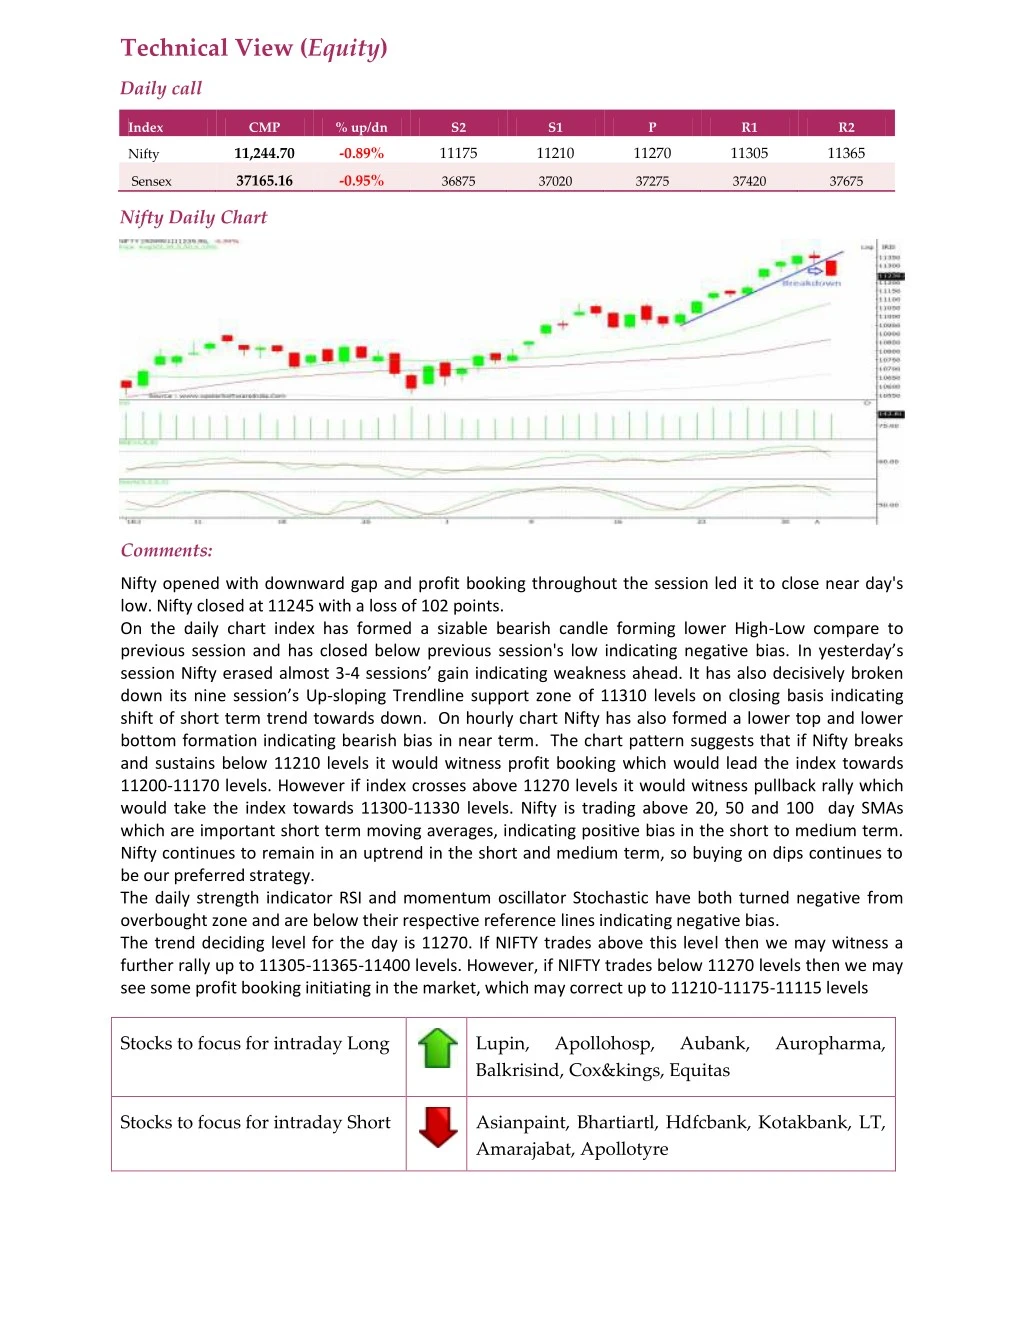
Technical View (Equity) Daily call Index CMP % up/dn S2 S1 P R1 R2 11,244.70 -0.89% 11175 11210 11270 11305 11365 Nifty 37165.16 -0.95% Sensex 36875 37020 37275 37420 37675 Nifty Daily Chart Comments: Nifty opened with downward gap and profit booking throughout the session led it to close near day's low. Nifty closed at 11245 with a loss of 102 points. On the daily chart index has formed a sizable bearish candle forming lower High-Low compare to previous session and has closed below previous session's low indicating negative bias.In yesterday’s session Nifty erased almost 3-4 sessions’ gain indicating weakness ahead. It has also decisively broken down its nine session’s Up-sloping Trendline support zone of 11310 levels on closing basis indicating shift of short term trend towards down. On hourly chart Nifty has also formed a lower top and lower bottom formation indicating bearish bias in near term. The chart pattern suggests that if Nifty breaks and sustains below 11210 levels it would witness profit booking which would lead the index towards 11200-11170 levels. However if index crosses above 11270 levels it would witness pullback rally which would take the index towards 11300-11330 levels. Nifty is trading above 20, 50 and 100 day SMAs which are important short term moving averages, indicating positive bias in the short to medium term. Nifty continues to remain in an uptrend in the short and medium term, so buying on dips continues to be our preferred strategy. The daily strength indicator RSI and momentum oscillator Stochastic have both turned negative from overbought zone and are below their respective reference lines indicating negative bias. The trend deciding level for the day is 11270. If NIFTY trades above this level then we may witness a further rally up to 11305-11365-11400 levels. However, if NIFTY trades below 11270 levels then we may see some profit booking initiating in the market, which may correct up to 11210-11175-11115 levels Stocks to focus for intraday Long Lupin, Balkrisind, Cox&kings, Equitas Apollohosp, Aubank, Auropharma, Stocks to focus for intraday Short Asianpaint, Bhartiartl, Hdfcbank, Kotakbank, LT, Amarajabat, Apollotyre