Download
1 / 24
240 likes | 344 Views
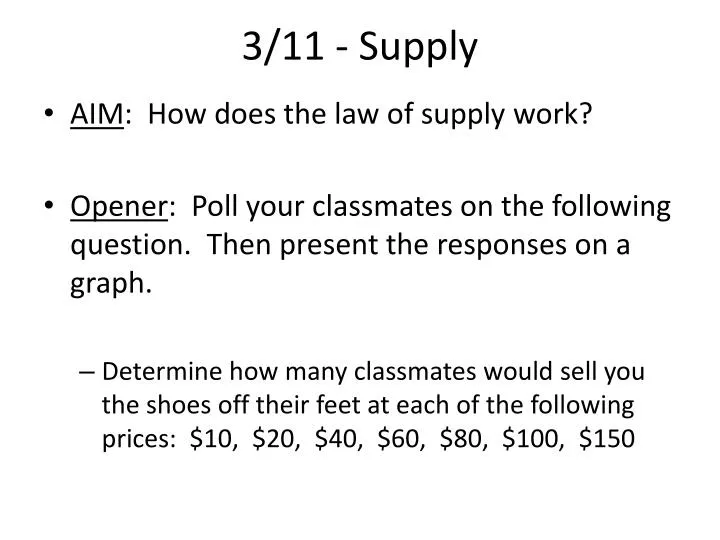
3/11 - Supply. AIM : How does the law of supply work? Opener : Poll your classmates on the following question. Then present the responses on a graph.

E N D
3/11 - Supply • AIM: How does the law of supply work? • Opener: Poll your classmates on the following question. Then present the responses on a graph. • Determine how many classmates would sell you the shoes off their feet at each of the following prices: $10, $20, $40, $60, $80, $100, $150
Law of Supply • The law of supply states that the higher the price of a good, the larger the quantity produced. • Existing companies will start making more • New companies will enter the market to get a share of the profits
Sample Supply Schedule (Remember, this is ceteris paribus – the assumption that everything stays constant except for the price.)
Elasticity of Supply • When supply is elastic, a small increase in price has a big effect on supply
Elasticity over time • Does supply become more or less elastic over time? Why? Consider this apple orchard
Elasticity of Supply • Analyze the following situations to determine how supply is elastic or inelastic in each case: • The price of milk increases • The price of a hair cut increases • The price of SAT tutoring increases • The price of tickets to a football game increases.
Challenge: • Can you come up with examples of goods whose supply curves are extremely inelastic?
3/12 – Costs of Production • AIM: How does a company decide how much labor to hire to produce a certain level of output? • Opener: Review from yesterday – Can you come up with examples of goods whose supply curves are extremely inelastic?
3/12 – Costs of Production • AIM: How does a company decide how much labor to hire to produce a certain level of output? • Homework: Read about marginal returns (p. 108-110. How did today’s exercise illustrate this concept?
Mickey Mouse Inc. • Company rules: • Only use the tools allocated to your team. (No personal tools allowed) • No tracing: all of our portraits are hand drawn with pride! • Incentives: The most productive teams will receive extra credit. • Each production shift will last for 3 minutes. • At the end of each shift, the shift leader should organize all finished faces for counting.
Mickey Mouse Inc. • Shifts: • Round 1: Individual • Round 2: Teams of 4 • Round 3: Teams of 8 • Round 4: Teams of 16
3/13 – Costs of Production • AIM: How does a company decide how much labor to hire to produce a certain level of output? • Opener: Reflect on yesterday’s exercise. What happened to our production output as we added more people to a team? What conditions helped production? What conditions hurt production?
Marginal Product of Labor • In economic terms, “marginal” means “additional”. • Marginal Product of Labor = the change in output from hiring one more worker. • Look at the chart on the right. How do you calculate the marginal product of labor?
Increasing and Diminishing Marginal Returns Why do marginal returns initially increase, but then start to decrease, and even become negative?
Marginal Product of Labor – Band 4 Marginal Product of Labor – Band 6
Production Costs: Fixed vs. Variable • Fixed Cost: A cost that does not change, no matter how much of a good is produced. • Variable Cost: Costs that rise or fall depending on the quantity produced. • Marginal Cost: The cost of producing one additional unit
Production Costs: Fixed vs. Variable • What are examples of both fixed and variable costs in your daily life?
Setting Output • How does a company know how much of a product to produce? Is there enough information on this chart to determine how many beanbags to produce? What additional info might you need?
Setting Output • How does a company know how much of a product to produce? Revenue = money the firm gets from selling its product.
Setting Output • How does a company know how much of a product to produce? Profit = Total revenues minus total costs
Setting Output • Examine the following table. How much should the company produce if the market price is $10?
Setting Output • What would happen if the market price dropped to $7? • What would happen if the market price rose to $11?
Setting Output • Can you see a shortcut to determine the best output without doing all the math?
Setting Output • The optimal output is when price (marginal revenue) is equal to the marginal cost.