Download
1 / 22
240 likes | 451 Views
acetyl transferases. NH 3 +. H N COCH 3. Platform Independent and Label-free Quantitation of Protein Acetylation and Phosphorylation using MS1 Extracted Ion Chromatograms in Skyline. deacetylases. Birgit Schilling Buck Institute for Research on Aging. OH. O PO 3 H -. kinases.

E N D
acetyl transferases NH3+ HNCOCH3 Platform Independent and Label-free Quantitation of Protein Acetylation and Phosphorylation using MS1 Extracted Ion Chromatograms in Skyline deacetylases Birgit Schilling Buck Institute for Research on Aging OH OPO3H- kinases phosphatase Workshop ASMS 2012
Mitochondrial Sirtuins and Metabolic Regulation • Type 2 Diabetes • Metabolic syndromes • High/low-fat diet • Aging • Neurodegenerative diseases? MOH, 9:30 am : M.Rardin et al. “Quantitation of the Mitochondrial Lysine Acetylome in SIRT3 Knockout Animals using MS1 Filtering in Skyline.”
Designing a Quantitative Discovery Immunoaffinity-based ‘Acetylproteome’ Workflow (D) Label-free Quantitation. Spectral counting, SuperHirn, MaxQuant, MultiQuant,… #1 sirt3 +/+ #2 sirt3 -/- #3 #4 etc.. IP HPLC MS/MS HPLC MS/MS HPLC MS/MS HPLC MS/MS ? IP
Label-free, quantitative full scan filtering workflows in Skyline MacLean et al., ASMS 2011 Poster: “Skyline: Targeted Proteomics with Extracted Ion Chromatograms from Full-Scan Mass Spectra” Buck Institute Workflows: Using an AB SCIEX TripleTOF™ 5600 System to identify and quantitate posttranslationally modified peptides. Ion chromatogram extraction (XICs) from MS1scans that were acquired as part of data dependent acquisitions (DDA). Skyline MS1 Filtering Schilling et al., ASMS 2012, Tuesday TP03 Poster 081
Tutorial MCP, May 2012 (http://proteome.gs.washington.edu/software/Skyline/tutorials/ms1filtering.html) Page 202–214
Skyline MS1 Filtering A quantitative tool for discovery proteomics experiments • Follow a few peptide analytes to >3000 peptides • Label-free • Post analysis design • Skyline interface and tools • MS platform/manufacturer independent (QqTOF, FT and ITs)* • MacLean et al., ASMS abstract 2011 • Schilling et al., MCP, 11, 2012, 202-214.
Proteomic Data Flow in Skyline MS1 Filtering Samples (1, 2, 3,… N) Mass Spectrometer Peptide Search Engine(s) (Mascot, Protein Pilot, X!Tandem, etc.) Raw data: MS1 Scans File import Skyline – ‘BiblioSpec’ MS/MS Scans Skyline– ‘Spectral Library’ Skyline – ‘ProteoWizard’ Skyline –‘Full Scan Filter’ Module Import fasta/proteome files XIC, automatic integration MS/MS directed peak picking ‘automatic and manual’ automatic generation of Skyline ‘Peptide Tree’ Peptide Ion Chromatograms ID annotations expected isotope distrib. irank idotp Skyline – ‘Visual Tools’ assess data quality and adjust peak integration Skyline – ‘Custom Reports’ Statistical Processing
3 5 1 2 4 Skyline interface for MS1 filtering data 5) M, M+1,M+2 precursor peak areas 3) MS/MS spectra and ID • 1) Peptide ‘tree’ with precursors • irank • idotp 2) RT and ID correlation; peak boundaries set for integration * * A3 A4 A5 A6 A7 4) RT variation among peptides and replicates for each precursor isotope (M, M+1,M+2) * A3 A4 A5 A6 A7
MS/MS (ID) directed Peak Picking for Skyline MS1 Filtering MS/MS from redundantspectral libraries A precursor M 621.8395++ precursor M+1 622.3410++ precursor M+2 622.8423++ * S1_R1 B S1_R1 S1_R2 S2_R1 S2_R2 * ** ** S2_R2 C S1_R1 S1_R2 S2_R1 S2_R2
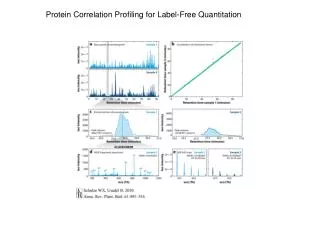
1100.54 (3) 1100.87 (3) 1101.21 (3) *1100.20 (3) Relative abundance 1101.54 (3) m/z Advantage of quantitating multiple precursor isotopes, M, M+1, M+2 Measured MS1 Peak Isotope distribution A B GTLLYGTPTMFVDILNQPDFSSYDFTSIR 3+ m/z=1100.20 Observed peak area CV over 9 replicates C D GTLLYGTPTMFVDILNQPDFSSYDFTSIR
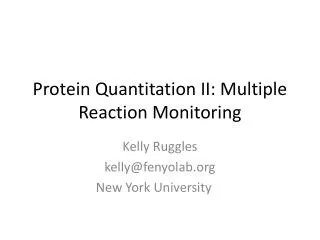
LOQ = 0.061 fmol (complex matrix) LOQ = 0.036 fmol (simple matrix) 1xe6 YAPVAKacDLASR++ 1xe5 observed peak area (log) 1xe4 1xe3 blank 0.004 0.012 0.037 0.111 0.333 1 3 25 LOQ = 0.062 fmol (complex matrix) LOQ = 0.040 fmol (simple matrix) 1xe6 LVSSVSDLPKacR++ 1xe5 observed peak area (log) 1xe4 1xe3 blank 0.004 0.012 0.037 0.111 0.333 1 3 25 MS1 Filtering Standard Concentration Curves for Lys-Ac Peptides TripleTOF 5600 • 6 peptide mix at 4 amol to 50 fmol • Both simple and complex matrices • Triplicate analysis +/- background matrices fmol (log scale) regression slopes: 1.03 & 1.03 for YAP 0.99 & 1.00 for LVS fmol (log scale)
Reproducibility for MS1 Scan Filtering Complex matrix, ABSCIEX TripleTOF 5600 Simple matrix, ABSCIEX TripleTOF 5600 Peak Area CV in % (3 repl.) Peak Area CV in % (3 repl.) 30% 30% 20% 20% 100 310 matrix peptides; MS1 (precursor M) Peak Area CV# Peptides 80 85% with CV<20% 0 - 20% 264 20 - 30% 33 60 30 - 40% 13 Peak Area CV in % (9 repl.) 40 30% CV 20% CV 20 350 550 750 950 1150 m/z
Identification of SIRT3 Substrates in Mouse Mitochondria Example, Skeletal muscle 31x 7.2x 4.2x Rardin et al., MS1 Quantitation of >2,000 acetyllysine peptides
Western blot for comparison PDHE1α pSer-232 pSer-293 pSer-300 Mouse Mitochondrial Liver– DCA treatment (Kinase inhibitor) MS1 Filtering for 3 phosphopeptides, Pyruvate DehydrogenaseE1α, 0-120 min DCA: dichloroacetate (pyruvate analog, inhibitor)
Polysome Changes - High Throughput MS1 Filtering Spectral libraries are generated for 40S, 60S, and 80S yeast polysome fractions WT RL22a-/- RL22b-/- RL22ab-/- yeast strains MS1 Filtering to comprehensively quantitate ribosomal proteins, ‘RL’ and ‘RS’ proteins (including paralogs) in the polysome fractions. Subunit changes ? Complex composition changes ? Protein RL22a quantitated (in 4 different yeast strains) 22b-/- 22b-/- 22ab-/- 22ab-/- 22ab-/- 22ab-/- 22b-/- 22b-/- 22b-/- WT WT WT WT 22a-/- 22a-/- 22a-/- 22a-/- 22a-/-
Greatly improved Raw File Import Speed (64 bit) and Memory Allocation Example: yeast polysomal proteins and interacting proteins MS1 Filtering for 2309 peptides, each M, M+1, M=2; total of 7191 “transitions” Import of 12x TripleTOF 5600 wiff files (90 minute gradient) Comparison of Skyline file import speed with different computer systems 32 bit, 2 core, 1 proc. 3.16 GHz, 3.3 GB RAM 276 min 64 bit, 4 cores, 1 proc. 3.30 GHz, 8.0 GB RAM 113 min 64 bit, 8 cores, 2 proc. 2.67 GHz, 12.0 GB RAM 99 min Advantage of file import with scheduled time window ( 2 min) around peaks 32 bit, 2 core 78 min 64 bit, 4 cores 29 min 64 bit, 8 cores 20 min • Scheduled File Import Advantages: • reduced import time • greatly reduced Skyline file size (8.6 GB vs 0.08 GB) • easier follow-up peak processing Skyline daily version 1.2.1.3628
Scheduled File Import during MS1 Filtering using RT from prepicked peaks R.LAFYQVTPEEDEEEDEE.- Replicate 1: Import of chromatogram 0-80 min R.LAFYQVTPEEDEEEDEE.- Replicate 2: Scheduled import with 2 min window around peaks
Integration of Skyline MS1 Filtering into Laboratory Workflows / Pipelines Discovery Mass Spectrometry data dependent data set MS1 spectra MS/MS spectra (data dependent) Peptide Identifications Generation of a Spectral Libraryin Skyline MS/MS-directed MS1 peak-picking MS1 Filtering in Skyline MRM transition selection quantitative information from Discovery Experiment Candidate Lists for Follow-up LC-MRM-MS assays (Verification)
MS1 full scan Filtering - Conclusion and Future Outlook • Platform and Vendor Independent • Open Source, continuous development and improvements (Skyline Team) • Easy label-free quantitation, particularly good for PTM peptide quantitation • Taking advantage of existing Skyline graphical displays and QC features • High throughput quantitative screening of discovery workflow experiments • Easy integration of MS1 Filtering results with follow-up MRM experiments • Combination of MS1 Filtering with Skyline iRT features • Retention Time (RT) alignment, also when no MS/MS was sampled
Acknowledgments B.W. Gibson, M.J. Rardin, M.P. Cusack, A. Zawadzka, D. Sorensen, S. Danielson, Monique O’Leary, Brian Kennedy – Buck Institute B. MacLean, M.S. Bereman, C. Wu, B. Frewen, M.J. MacCoss – Univ. Washington E. Jing, R. C. Kahn – Harvard E. Verdin – Gladstone P. Drake, S. Fisher – UCSF C. Hunter, S. Seymour – AB SCIEX J. Cottrell – Matrix Science NIH, NCI (CPTAC)
Skyline MS1 Filtering specific parameters and Utilizing Grid View Skyline Results Grid View A B (LTQ FT-ICR-MS platform) • All parameters such as • irank, observed rank • idotp, isotope distribution % • underlying MS/MS signal for MS1 peak? • can be exported to Skyline custom reports idotp deviation from “1”