Download
1 / 10
110 likes | 230 Views
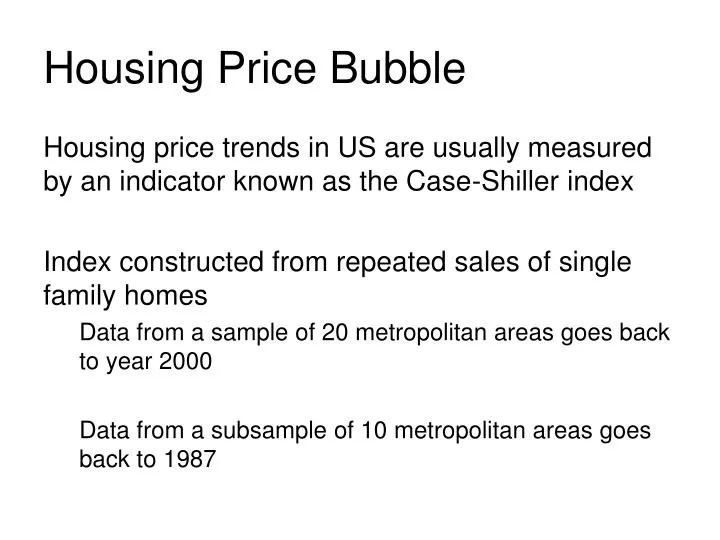
Housing Price Bubble. Housing price trends in US are usually measured by an indicator known as the Case- Shiller index Index constructed from repeated sales of single family homes Data from a sample of 20 metropolitan areas goes back to year 2000

E N D
Housing Price Bubble Housing price trends in US are usually measured by an indicator known as the Case-Shiller index Index constructed from repeated sales of single family homes Data from a sample of 20 metropolitan areas goes back to year 2000 Data from a subsample of 10 metropolitan areas goes back to 1987
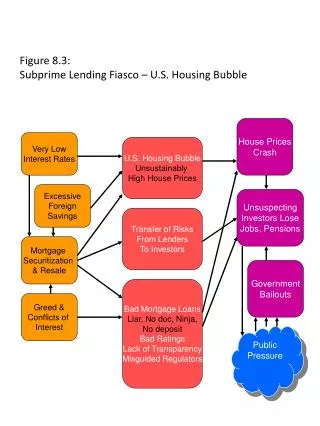
From 1987 to 2000 housing prices in the urban areas rose 2% per year • From 2000 to 2006 prices were increasing at a rate of 13% a year • Average housing prices doubled over the sample of urban areas from 2000 to 2006
From 2006 through 2009, housing prices have fell roughly 11.5% per year • Prices began to rise in 2012
Metropolitan Areas with largest housing decline over 2007-2008