Download
1 / 23
270 likes | 498 Views
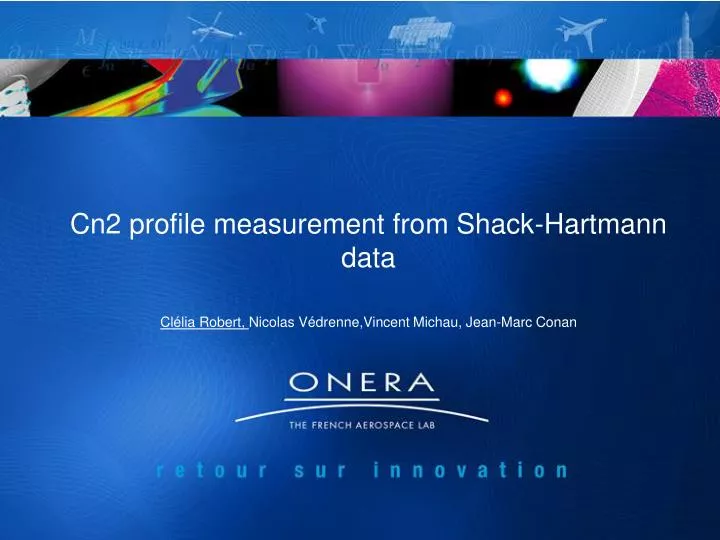
Cn2 profile measurement from Shack-Hartmann data. Clélia Robert, Nicolas Védrenne,Vincent Michau, Jean-Marc Conan. C n ² ?. C n ² ?. C n ² ?. C n ² ?. C n ² ?. C n ² ?. A new method to profile C n 2. Measurement of C n ² profile. Motivation and techniques Shack-Hartmann data

E N D
Cn2 profile measurement from Shack-Hartmann data Clélia Robert, Nicolas Védrenne,Vincent Michau, Jean-Marc Conan
Cn² ? Cn² ? Cn² ? Cn² ? Cn² ? Cn² ? A new method to profile Cn2
Measurement of Cn² profile Motivation and techniques Shack-Hartmann data Exploitation to measure Cn2 profile Numerical validation
Cn2 Profile Dimensioning systems Evaluation of performances A priori for servo-loop laws Profile knowledge: Profile from Observatoire de Haute Provence (ballon sonde) High variability Need of profile monitoring How to measure ?
Spectral analysis of scintillation structures TF PSDχ(ν) h ν (λh)-(1/2) Principles of Cn2 profiling : single source intensité dans la pupille No sensitivity to law altitude layers (no propagation) More operations needed (mode: « generalized») More uncertainties MASS (V. Kornilov, A. Tokovinin) SSCIDAR (D. Garnier) Single source: low vertical resolution
θ Xh Principles of Cn2 profiling : multiple source θ h Intensities: Cross-correlations of scintillation indices: G-SCIDAR (J. Vernin, V.A. Klueckers) Slopes: Cross-correlations ofwavefront slopes: SLODAR (R.W. Wilson) What about simultaneous exploitation of slopes and intensities ?
Measurement of Cn² profile Motivation and techniques Shack-Hartmann data Exploitation to measure Cn2 profile Numerical validation
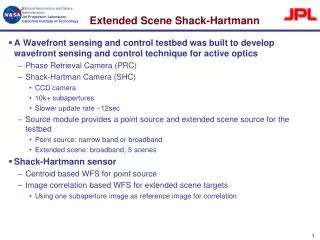
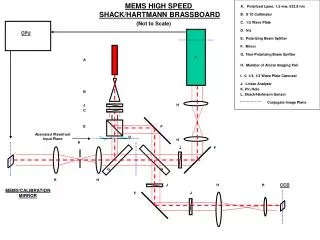
Shack Hartmann Wavefront sensor α α y m rm x SH data: sm(θ) = wavefront slopesaveraged on subaperture atrm im(θ) = averaged intensity of the incident wave on subaperture at rm
rm Propagation + subaperture averaging Small perturbation approximation (Rytov regime, σχ2 < 0.3) Correlations of data (intensities & slopes): h m
Propagation + subaperture averaging Correlations of data (intensities & slopes): θ θh – rm rm h m
Propagation + subaperture averaging Correlations of data (intensities & slopes): θ h n m dmn
Propagation + subaperture averaging Correlations of data (intensities & slopes): θ h θh Altitude of maximum sensitivity n m dmn
Propagation + moyenne sur la sous-pupille Correlations of data (intensities & slopes): θ h θh n m dmn Measurement unknown Weighting
Shack-Hartmann ++ !! Correlations of Shack-Hartmann data Slopes SLODAR SCIDAR, MASS Intensities Coupling
n dmn dy dy sensitivity: m Law layers High layers dx 5 % 15 % 80 % Complementarity of measurements Slopes Intensities Shack-Hartmann: D= 0.4 m,16 x 16, λ = 0.5 μm Se: Simultaneous exploitation: better sensitivity
Measurement of Cn² profile Motivation and techniques Shack-Hartmann data Exploitation to measure Cn2 profile Numerical validation
Direct problem: Problem statement Estimated covariances: SHdata:sm(θ), im(θ): xki Pseudo data ou Single source Multiple sources : covariance of detection noise (bias) : weighting functions : statistical noise on
Pseudo-data: Noise treatment: Subtraction of detection noise bias Limited statistic (convergence noise) Covariance matrix Cnoise Calibration Criterion to minimise relatively to S (Cn2 profile) -1 A priori Data likelihood : regularisation parameter (depends on h) Minimisation of J with positivity constraint Inversion of direct problem
Measurement of Cn² profile Motivation and techniques Shack-Hartmann data Exploitation to measure Cn2 profile Numerical validation
θ = 10 arcsec. Object model: binary star + Simulation of turbulent screens + Diffractive propagation Code PILOT 32 layers/ 400 frames Data: sm(θ), im(θ) Simulation: + Shack-Hartmann: 16 x 16, d = 2.5 cm, λ = 0.5 μm (D = 40 cm)
N. Védrenne, V. Michau, C. Robert, J.-M Conan, « Improvements in Cn2 profile monitoring with a Shack-Hartmann wavefront sensor », Proc. SPIE Vol. 6303, septembre 2006. N. Védrenne, V. Michau, C. Robert, J.-M Conan, « Full exploitation of Shack-Hartmann data for Cn2 profile measurement », OL, octobre 2007 Preliminary results
Processing of real data (SLODAR) Study of nois effect (photons, detector, quantification) Conclusion and perspectives: Proposition of two original methods to profile Cn2 New exploitation of the Shack-Hartmann Sensitivity Validated numerically Calibration Adaptation to close binary, moon edge, sun edge Determination of wind profile Influence of external scale?