Download
1 / 1
10 likes | 76 Views
STUDY 1. STUDY 2. METHOD. MOTIVATION. Figure 2: The interaction between Cluster B and Cluster C. Figure 1:The interaction space of our 15 LDRT predictors. Mapping Out the Relationships Between 15 Variables Involved in Lexical Access. Geoff Hollis & Chris Westbury

E N D
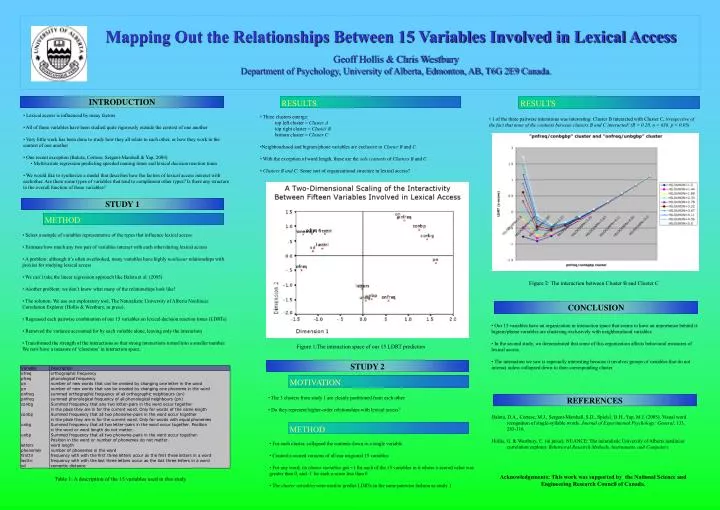
STUDY 1 STUDY 2 METHOD MOTIVATION Figure 2: The interaction between Cluster B and Cluster C Figure 1:The interaction space of our 15 LDRT predictors Mapping Out the Relationships Between 15 Variables Involved in Lexical Access Geoff Hollis & Chris Westbury Department of Psychology, University of Alberta, Edmonton, AB, T6G 2E9 Canada. INTRODUCTION RESULTS RESULTS • Lexical access is influenced by many factors • All of these variables have been studied quite rigorously outside the context of one another • Very little work has been done to study how they all relate to each other, or how they work in the context of one another • One recent exception (Balota, Cortese, Sergent-Marshall & Yap, 2004) • Multivariate regression predicting speeded naming times and lexical decision reaction times • We would like to synthesize a model that describes how the factors of lexical access interact with eachother. Are there some types of variables that tend to compliment other types? Is there any structure to the overall function of these variables? • Three clusters emerge: • top left cluster = Cluster A • top right cluster = Cluster B • bottom cluster = Cluster C • Neighbourhood and bigram/phone variables are exclusive to Cluster B and C. • With the exception of word length, these are the sole contents of Clusters B and C • Clusters B and C: Some sort of organizational structure in lexical access? • 1 of the three pairwise interations was interesting: Cluster B interacted with Cluster C, irrespective of the fact that none of the contents between clusters B and C interacted! (R = 0.20, n = 638, p < 0.05) • Select a sample of variables representative of the types that influence lexical access • Estimate how much any two pair of variables interact with each other during lexical access • A problem: although it’s often overlooked, many variables have highly nonlinear relationships with proxies for studying lexical access • We can’t take the linear regression approach like Balota et al. (2005) • Another problem: we don’t know what many of the relationships look like! • The solution: We use our exploratory tool, The Naturalistic University of Alberta Nonlinear Correlation Explorer (Hollis & Westbury, in press). • Regressed each pairwise combination of our 15 variables on lexical decision reaction times (LDRTs) • Removed the variance accounted for by each variable alone, leaving only the interaction • Transformed the strength of the interactions so that strong interactions turned into a smaller number. We now have a measure of ‘closeness’ in interaction space. CONCLUSION • Our 15 variables have an organization in interaction space that seems to have an importance behind it: bigram/phone variables are clustering exclusively with neighbourhood variables • In the second study, we demonstrated that some of this organization affects behavioral measures of lexical access. • The interaction we saw is especially interesting because it involves groups of variables that do not interact unless collapsed down to their corresponding cluster • The 3 clusters from study 1 are cleanly partitioned from each other • Do they represent higher-order relationships with lexical access? REFERENCES • Balota, D.A., Cortese, M.J., Sergent-Marshall, S.D., Spieler, D.H., Yap, M.J. (2005). Visual word • recognition of single-syllable words. Journal of Experimental Psychology: General, 133, • 283-316. • Hollis, G. & Westbury, C. (in press). NUANCE: The naturalistic University of Alberta nonlinear • correlation explorer. Behavioral Research Methods, Instruments, and Computers. METHOD • For each cluster, collapsed the contents down to a single variable • Created z-scored versions of all our origional 15 variables • For any word, its cluster variables got +1 for each of the 15 variables in it whose z-scored value was greater than 0, and -1 for each z-score less than 0 • The cluster variables were used to predict LDRTs in the same pairwise fashion as study 1 Table 1: A description of the 15 variables used in this study Acknowledgements: This work was supported by the National Science and Engineering Research Council of Canada.