Download
1 / 21
210 likes | 304 Views
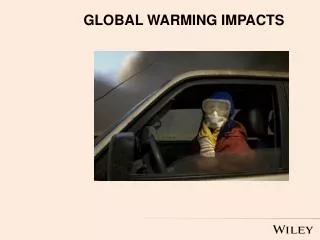
GLOBAL WARMING IMPACTS. Fig_06_01. Departures from 1951-80 March temperatures (NASA). Fig_06_02. Rate of temperature change, 1901-2008. Fig_06_03. Fig_06_04. Percent change over the last 50 years in average annual precipitation. Fig_06_05. Average # days above 90F from 1961-2099.

E N D
Fig_06_01 Departures from 1951-80 March temperatures (NASA)
Fig_06_02 Rate of temperature change, 1901-2008
Fig_06_04 Percent change over the last 50 years in average annual precipitation
Fig_06_05 Average # days above 90F from 1961-2099
Fig_06_06 Shifts in projected forests under global warming
Fig_06_07 Winter temperature trends 1975-2007 affects growing season, pests
Fig_06_09 % of total 19,958 deaths due to hazards from 1970-2004.
Fig_06_10 Geography of existing vulnerability to climate-sensitive health issues
Fig_06_11 20th Century precipitation changes.
Fig_06_12 # Days temperature exceeds 90F
Fig_06_13 Shift in climate zones will lead to warmer, drier conditions in the Midwest.
Summer temperature changes by end of the Century Low emission scenario High emission scenario Source: http://nca2009.globalchange.gov/great-plains
Fig_06_15 Future precipitation: Spring decreases for 2080-99 compared to 1961-79 mean.
Fig_06_16 What’s going to happen to the coasts?
Fig_06_17 Fairbanks, Alaska trend in longer frost-free season. What are the benefits? Costs?