Download
1 / 55
550 likes | 709 Views
The Federal Program SAFETEA-LU and Beyond. Presented By: Sandy Straehl Transportation Planning Administrator March 2, 2006. Discussion Topics. MONEY The Donor / Donee Dynamic Federal Highway Trust Fund Authorization vs. Appropriations Earmarks and Allocations Programs State

E N D
The Federal ProgramSAFETEA-LU and Beyond Presented By: Sandy Straehl Transportation Planning Administrator March 2, 2006
Discussion Topics • MONEY • The Donor / Donee Dynamic • Federal Highway Trust Fund • Authorization vs. Appropriations • Earmarks and Allocations • Programs • State • Federal Program Changes
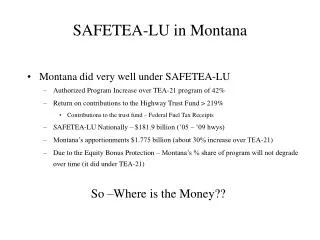
For Every $1.00 collected in Federal Fuel Taxes in Montana – the state received about $2.25 A $1.00 in state fuel tax leverages about $6.50 in federal highway funds. 47.1 jobs are sustained for every $1 million in highway investments ---- about 16,000 jobs annually SAFETEA-LU – $181.9 billion (’05 – ’09 hwys) Montana’s apportionments $1.775 billion (about 30% increase over TEA-21) Importance of Highway Program to Montana
Donors Fewer $$ back than in Texas, Florida, Georgia, Indiana, Michigan..about 21 TEA-21 guaranteed 90.5% of % contribution SAFETEA-LU Guaranteed 91% of % Donee More $$ back than in 2 classes Protected % share Montana, WY, ID, NV, ND, SD, NM Protected Ranges New York, New Jersey, Donor / Donee
Millions Generated For Each Cent of State Fuel Tax In Millions Fuel Tax Rate Need for Montana to Match Revenue Generated in these States Fuel Tax per Gallon Source: 2003 Highway Statistics Table MF-12IT; Gasoline Tax Rates
Rural Highway Travel as a Percentage of Total Travel Montana’s Transportation System serves as a crucial bridge across the nation. Source: 2003 Highway Statistics Table PS-1
The distance across Montana is greater than the distance between Washington D.C. and Chicago. Chicago D.C. IL VA
Montana a Land Area Population (Square Miles) 145,552 918,000 Northeastern States Land Area Population (Square Miles) 3,460,000 6,433,000 1,299,000 1,139,000 19,158,000 1,048,000 619,000 CT MA ME NH NY RI VT Total 4,845 7,840 30,862 8,968 47,214 1,045 9,250 110,024 33,156,000 Montana is huge in land area - and sparse in population Montana Source: 2003 Highway Statistics Table PS-1
Per Capita Contributions to State and Federal Highway Trust Funds * US Average $252.09 US Average * Includes contributions for Highways, Mass Transit and State Tax Receipts. 2003 Hwy Stat tables FE-9 & MF-1
Formula Funding Program IM formula attributes $$ + NH Formula attributes + Subsequent Formula programs accumulate to state total + Below the Line Earmark Project funds = Sum of programs is compared to Equity Bonus Guarantee and funds are added Three types of Equity Bonus Guarantees: Donor % guarantee return on % contributed to trust fund Eastern Donee % min/max growth Western Donee Locked % guarantee (Montana!)
Comparison of Quality of GuaranteesAnnually 1% of the Highway Program = about $345 - $360 m
% Program Lock Essential for Montana’s Program • 18 states are protected under SAFETEA-LU • % share of program will not degrade • State share protected for: • Low population density (40 persons/sq mile) • High Federal Land Ownership (25% or greater land area) • Low population ( < 1,000,000) • Low median household income (< $35,000) • High Interstate Fatality Rate
Obligation Limitation Impact on MDT’s Core Program Apportionment FY 2006 Apportioned Funds = $339,067,668 Less 30% High Priority Projects = $9,876,000 Core Project Program Apportionments = $329,191,668 (IM, NHS, STP, BR, CMAQ, Safety, Rec Trails, Borders Safe Routes 2 School) Obligation Limitation – 85% of Apportioned FY 2006 Ob Limit (.85* $339.0 million) = $288,207,517 Less 30% High Priority Projects (assume 100% funded) = $9,876,000 Core Program Obligation Authority = $278,331,517 * (Sec 1702 Earmarks) * For Comparison FY 2003 Obligation Authority for Core Programs was $277 million Notes: * Approximately 70% of the projects named for Montana in Section 1702 were from MDT’s Core Program categories.
SAFETEA-LU Funding Estimates Little Actual Program Growth in Spendable Dollars SAFETEA-LU Millions SAFETEA-LU Spendable Dollars FY 2003 Notes: Obligation limitation is 85% of Apportionment. Years beyond FY 2009 estimates based on Highway Trust Fund balance projections
Funding Flow for Federal Transportation Funds Authorization Safe, Accountable, Flexible, Efficient Transportation Equity Act: A Legacy for Users (SAFETEA-LU) Apportionment & Annual Appropriation Act (Obligation Limitation) Bridge (HBRRP) • Directed Funds • High Priority • Trans. Improvements • Approp. Earmarks Rural & Elderly & Disabled Transit Capital (Sections 5311/5310) Urban Transit (Section 5307) Urbanized Planning Support (PL) Surface Transportation Program (STP) Safe Routes to School SAFETEA-LU Section 1404 Coordinated Border Infrastructure Program SAFETEA-LU Section 1303 Congestion Mitigation & Air Quality Improvement (CMAQ) Interstate Maintenance (IM) National Highway System (NHS) Urbanized Areas (>50,000) Urbanized Areas (>50,000) Statewide Montana Transportation Commission • Federal Lands Highway Program (FLHP) • Public Lands Highways • Parkways & Park Roads • Indian Reservation Roads (IRR) • Refuge Roads Transfers allowed between categories in accordance with Federal laws Statewide Distribution Statewide Distribution Within 200 Miles of Border-High Volume NH Routes Statewide Distribution Montana Air & Congestion Missoula Initiative (MACI) -Guaranteed -Billings -Great Falls -Discretionary Enhancement (10% of STP) Hazard Elimination (10% of STP) Urban High Growth Adjustment Urban High Growth Adjustment Urban Highway Preservation Secondary Highway Program Urban Highway Program Primary Highway Program >15% Population Increase 15 Urban Areas (Pop. >5,000) Statewide Distribution CTEP (Distributed by formula) 15 Urban Areas Financial Districts (Pop. >5,000) Districts Federal Funding Category Distribution Guided by Policy or Agreement State Funding Category Distribution Guided by State Law Distribution Guided by Federal Law January 2006 Montana Department of Transportation
Decision- Making Balance and Program Authority • SAFETEA-LU requires new consultation – but did not change the balance of authority in the federal program • New planning level consultation will now include: economic development, resource agencies, planned growth
MPO – State Decision Making • Consultation – confer and consider other party’s views before taking action • Cooperation – involved parties carry out the processes and work together jointly to achieve a common goal • Coordination – consistency
SAFETEA-LU Emphasis Areas Important for Montana • TRANSIT • SAFETY • Environmental changes
MDT Transit Programs A NEW DAY FOR TRANSIT IN MONTANA
Impact on Montana • Locally developed coordination plan • Large increase in funding • Match Relief
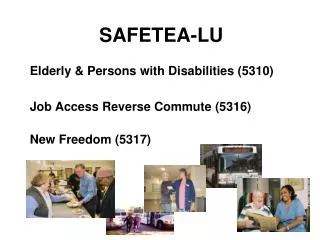
Major Transit Funding Programs (With Billings FY ’06 Funding) Federal Section 5307-Urbanized transit systems (50/50 operating-80/20 capital) $1,178,567 Section 5303-Urbanized transit planning 133,988 JARC-Job Access Reverse Commute 79,756 New Freedom 91,621 Section 5310-Elderly and disabled(87/13 capital)$ 81,858 Section 5311-Rural general public(54/46 operating-87/13 capital)0 Section 5309-Buses & bus facilities (80/20 capital) (prior year projects) 3,105,131 State TransADE-Transportation Assistance for Disabled & Elderly $40,059 *New with SAFETEA-LU
Major SAFETEA-LU Transit Changes New Coordination Requirements Beginning FFY 2007 all Section 5310, JARC, & New Freedom projects must be consistent with locally developed coordination plans. Funding Increases for Montana (FFY ‘05-FFY ’06)
Non- Federal Match Ratio Changes Pre- SAFETEA-LU SAFETEA-LU Capital Assistance 80% Federal & 20% Local Capital Assistance 86% Federal & 14% Local Operating Assistance 50% Federal & 50% Local Operating Assistance 54% Federal & 46% Local Administration Assistance 80% Federal & 20% Local Maintenance Assistance 80% Federal & 20% Local Note: Federal Human Service and Indian Reservation Road Fundscan be used to Match FTA Funds.
Factors that Combine to Form a New Vision • Local coordination plans required • This means one provider for public and human service transportation • Human Service Transport Costs can match FTA money (Medicaid, DD services, job training, etc.) • Significant Increase in most flexible category
Example Scenario: OLD WORLD OPERATING Anytown, Montana Transportation Providers
Example Scenario: NEW WORLD OPERATING Anytown, Montana Transportation Providers Developmentally Disabled Center Senior Citizen Center $$$$ $$$$ $$$$ Consolidated Provider $$$$ Nursing Home Other Human Service Agencies
Transit Application Process Changes With the increase in FTA funding, MDT will implement the following changes: • Application process simplified • One application for Capital • One application for Operating • Locally Developed Coordination Plan • Deadlines Eliminated
SAFETY Provisions • Safety program • Program growth about 40% • No longer a set-aside – program will ramp up • Requirement to do a Strategic Highway Safety Plan • Eligibilities expand based on plan • Possible transfer to behavioral programs (Sec. 402) • New Data reporting including top safety locations
MDT’s Approach –Statewide Comprehensive Safety Plan • Began in Aug. 2004 in anticipation of Act • MDT offices: Director’s Office, MCS, Engineering, SHTSO, Planning • Non-MDT: OPI, Highway Patrol, DPHHS, members of the Court, FHWA, Motor Carriers, Safe Kids/Safe Communities, Emergency Responders, Tribal Governments, MPOs, local law
Objectives of a Comprehensive Safety Plan for Montana • Establish specific safety-related goals and objectives relevant to all modes of transportation • Address issues at all levels of jurisdiction • Identify candidate safety strategies and evaluate • Establish a process for prioritizing strategies • Establish a mechanism for interagency coordination and partnerships • Carry out a program of public outreach and education • Develop a strategic implementation plan with specific action items
To Date • Identified a long-term goal • Identified and set up work teams for 13 safety objectives • Have performed 3 corridor safety audits • Have hosted a Tribal Safety Forum • Have Completed a Strategic Traffic Records Assessment
Why all this is needed- Montana Statistics for 2003 262 Fatalities 4446 Injuries $780 Million Cost to the State
Comparison Statistics Fatality Rate (per 100M VMT) U.S.: 1.5 MT: 2.6 Best: .81 Alcohol Related U.S.: 41% MT: 47% Best: 22% Safety Belts U.S.: 41.3% MT: 28% Best: 59.3%
Rate 4.0 MT Alcohol Related U.S. Alcohol Related MT Total U.S. Total 3.5 3.0 2.5 2.0 1.5 1.0 0.5 0.0 ‘82 ‘83 ‘84 ‘85 ‘86 ‘87 ‘88 ‘89 ‘90 ‘91 ‘92 ‘93 ‘94 ‘95 ‘96 ‘97 ‘98 ‘99 ‘00 ‘01 ‘02 Year Impaired DrivingAlcohol Related Fatalities per 100 Million VMT, Montana, 1982-2002
Perspective on Fatal Crash Characteristics • Distracted driving (25%) • Impaired driving (41%) • Roadway departures (38%) • Speeding (31%) • Failure to wear safety belts (59% unrestrained) • Intersections (21%) • Pedestrians (11%) • Pedalcyclists (2%) • Trucks (11%) • Motorcycles (8%) Total = 247%
Comp Safety Plan Goals • Reduce the statewide fatality rate from 2.05 per 100 million vehicle miles traveled in 2004 to 1.79 by 2008 • Further reduce the statewide fatality rate to 1.0 per 100 million vehicle miles traveled by 2015 • By reducing the fatality rate, Montana's incapacitating injuries will also fall from 1,700 in 2005 to 950 in 2015.
Plan Status • Working Groups set up for Each of the 13 Objective areas • Commitments have been identified and new countermeasures defined • Plan will go back before multi-agency group in April • Gov. will meet again with Tribes in April
Safe Routes To School New SAFETEA-LU Program!
SAFE Routes To School Montana will receive $1 million annually to support Safe walking and biking to elementary and middle schools A full time Coordinator required 70% for infrastructure 30% for Behavioral There are 816 school buildings in Montana and 405 School Districts
SAFE Routes To School Montana’s Annual Allocation will not increase during SAFETEA-LU -- MT is a minimum apportionment state - $1 million per year. • Montana Approach – estimated launch July, 2006 • Infrastructure managed through CTEP program • SR2S will be used as an incentive for local governments to select bike/ped CTEPprojects close to school • Example: 100% federal funds can expand a local government’s CTEP allocation and encourage bike/ped close to schools versus another project
SAFE Routes To School • Montana Approach (con’t) • Behavioral programs will coordinate with State Highway Traffic Safety Office • SR2S Coordinator is being solicited through an RFP -- selection criteria focused experience with communities and schools
Environment – Relative to Planning • New requirements for visualization • Mitigation: long-range transportation plans must include potential environmental mitigation activities and potential locations to carry them out • Developed in consultation with Fed/State/Tribal wildlife, land management, and regulatory agencies
Corridor Studies – Planning Products for Future NEPA • Able to graduate an alternative set and purpose and need statement into NEPA from Planning….if • Thorough record of public involvement and sound technical analysis