Download
1 / 19
190 likes | 338 Views
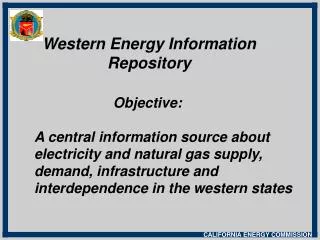
WESTERN ENERGY INFRASTRUCTURE ASSESSMENT. Energy Infrastructure Policy Group Office of Energy Projects Docket No. AD03-10-000 Item A-3 July 23, 2003. Western Region. Source: RDI PowerMAp.

E N D
WESTERN ENERGY INFRASTRUCTURE ASSESSMENT Energy Infrastructure Policy Group Office of Energy Projects Docket No. AD03-10-000 Item A-3 July 23, 2003
Western Region Source: RDI PowerMAp
From Jan. 2000 to May 2003, generation capacity in the West has increased 15% with the Southwest (AZNMNV) region leading with 32% growth. NWPP (7%) Total WECC Capacity (MW) 165,422 53,881 57,840 144,214 RMPA (21%) 10,710 CAMX (13%) 13,009 55,497 62,739 AZNMNV (32%) 24,178 31,835 Source: RDI PowerDat, May 2003 release and Jan. 2001 release.
NWPP AZNMNV RMPA CAMX Additions of generating capacity rose dramatically after 2000 in response to supply shortages; however, additions will drop sharply after 2003 and retirements will increase. ADDITIONS RETIREMENTS Sources: POWERdat May 2003; NewGen May 2003; CAISO
The West’s dependency on natural gas for generation capacity has grown steadily over the years, and could replace hydro as the number one fuel source in 2005. 1% 3% 7% 37% 25% 5% 4% 20% 22% 42% 32% Sources: POWERdat May 2003 (Demonstrated Capacity); NewGen May 2003
In 2002, net generation in the West decreased 6% from 2000 levels reflecting reduction in demand. Total WECC generation output (GWh) NWPP (-7%) 650,573 612,762 252,689 234,179 RMPA (3%) 60,732 59,018 CAMX (-11%) 199,999 178,381 AZNMNV (1%) 138,867 139,470 Source: RDI PowerDat
MapSlide 7 Public access for the above information is available only through the Public Reference Room, or by e-mail at public.referenceroom@ferc.gov
Hydropower exports from the Pacific Northwest to California have declined as energy demand in this region has increased. Source: CEC,NWPPC, U.S. Census Bureau and EIA.
Coal-fired generation is 21% (34,240 MW) of total generation capacity in the West. Over 75% of the electricity output from coal generation is from plants in Wyoming, Arizona, Colorado, Utah and New Mexico. Existing generation capacity fuel mix Source: RDI PowerDat
MapSlide 10 Public access for the above information is available only through the Public Reference Room, or by e-mail at public.referenceroom@ferc.gov
MapSlide 11 Public access for the above information is available only through the Public Reference Room, or by e-mail at public.referenceroom@ferc.gov
MapSlide 12 Public access for the above information is available only through the Public Reference Room, or by e-mail at public.referenceroom@ferc.gov
Over the past 10 years, the electric generation has been the fastest growing sector in the West and is now the largest gas consuming sector. Source: EIA’s Natural Gas Annual 2001 with supporting data, and EIA’s Historical Consumption by State
MapSlide 14 Public access for the above information is available only through the Public Reference Room, or by e-mail at public.referenceroom@ferc.gov
The West is dependent on production from gas originating mainly in the Rockies, Southwest and Canada. Western Gas Facts - 2001 Source: EIA’s Natural Gas Annual 2001 and US Crude Oil, Natural Gas, and Natural Gas Liquid Reserves 2001 Annual Report
MapSlide 16 Public access for the above information is available only through the Public Reference Room, or by e-mail at public.referenceroom@ferc.gov
Pending and anticipated pipeline projects will create new capacity to serve electric generation loads and to deliver gas from producing areas. • Twenty-eight projects were certificated since 2001, adding 6,481 MMcf/d of new capacity to the Western States. • Fifteen of these projects added 3.4 Bcf/d of new capacity from the Rocky Mountain region. Ten of these projects added 2.8 Bcf/d of new capacity from Wyoming. • Five pending projects have a projected capacity of 819 MMcf/d. Approximately 560 MMcf/d represents the Cheyenne Plains Project which will impact deliveries out of the Rockies and Wyoming. • Thirteen planned projects have a potential capacity of 7.2 Bcf/d. Nine of these projects have a potential capacity of 4.2 Bcf/d to move Rockies gas.
MapSlide 18 Public access for the above information is available only through the Public Reference Room, or by e-mail at public.referenceroom@ferc.gov