Download
1 / 35
350 likes | 509 Views
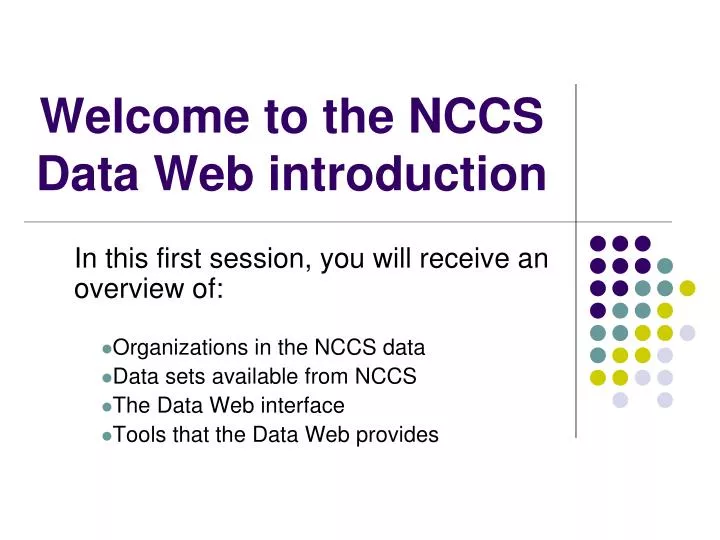
Welcome to the NCCS Data Web introduction. In this first session, you will receive an overview of: Organizations in the NCCS data Data sets available from NCCS The Data Web interface Tools that the Data Web provides. About NCCS.

E N D
Welcome to the NCCS Data Web introduction In this first session, you will receive an overview of: Organizations in the NCCS data Data sets available from NCCS The Data Web interface Tools that the Data Web provides
About NCCS • The National Center for Charitable Statistics is the national clearinghouse of data on the nonprofit sector in the United States. NCCS is a program of the Center on Nonprofits and Philanthropy (CNP) at the Urban Institute. www.nccs.urban.org.
About Data Web • The NCCS Data Web is intended to provide a user-friendly interface for nonprofit researchers and others with some familiarity with data analysis. • This interface was built using a set of reusable software objects developed at the Urban Institute to provide a standard interface for such tasks as: Survey data entry. Data review and editing. Data analysis and reporting
Types of Organizations Before selecting the data file you wish to use, you will need to understand the different types of nonprofit organizations: • 501(c)(3) public charities include most nonprofit organizations involved in the arts, education, health care, human services, and community service, as well as many others. More than 200,000 organizations filed in recent years. • 501(c)(3) private foundations are primarily (but not exclusively) grantmaking organizations like the Ford Foundation or the Pew Charitable Trusts that make grants to other nonprofit organizations. More than 50,000 foundations filed in recent years. • Other exempt organizations registered with the IRS include trade unions, business leagues, social and recreational clubs, and veterans associations classified under varying sections of the IRS code (e.g., 501(c)(4)). More than 120,000 organizations filed in recent years.
Filing Status • You also need to understand the division between organizations that must file with the IRS annually and those that have merely completed their initial registration with the IRS. • Organizations that report gross receipts of more than $25,000 in a fiscal year are generally required to file a Form 990 with the IRS unless they are religious congregations, denominations, or controlled by a congregation or denomination. (See the IRS Form 990 instructions for details). • Approximately two-thirds of the organizations that are registered with the IRS do NOT file a Form 990 with the IRS in any given year. Congregations and some other religious organizations as well as organizations with less than $25,000 in gross receipts are in this category.
The Core Files • The Core Files, produced annually, combine descriptive information from charities' initial registration with financial variables from the Form 990, 990-EZ, or 990-PF. Only organizations required to file these forms are included in the files. The 1996 Core File contains 83 variables for 190,844 organizations. Each year, NCCS creates several Core files: • 501(c)(3) public charities filing Forms 990 or 990-EZ and reporting gross receipts of at least $25,000. (View the data dictionaries or Form 990 with field names.) • Other exempt organizations (501(c)(4) "social welfare organizations", trade unions, etc.) • 501(c)(3) private foundations • "Zero filers" (Organizations filing with the IRS but reporting less than $25,000 in gross receipts. No financial data is available for these organizations.)
The IRS Business Master Files • The IRS Business Master Files are cumulative files containing descriptive information on all active tax-exempt organizations. Data contained on the BMF are mostly derived from the IRS Forms 1023 and 1024 (the applications for IRS recognition of tax-exempt status). NCCS downloads these files biannually. The October, 1997 BMF, for example, contains 28 descriptive variables and two financial variables (assets and income) for 637,272 501(c)(3) organizations. Two types of BMF files are available: • 501(c)(3) organizations (public charities and private foundations) • Other exempt organizations (501(c)(4) "social welfare organizations", trade unions, etc.)
The SOI Files and the Digitized Data • The IRS Statistics of Income Sample (SOI) Files are produced annually and include more than 300 variables for samples of 10,000 to 11,000 public charities. Other SOI files are available for Form 990-EZ filers, private foundations, and other exempt organizations (not 501(c)(3)s). • The NCCS-GuideStar National Nonprofit Database (also known as "the Digitized Data") contains multiple files for 501(c)(3) public charities filing Forms 990 or 990-EZ with the IRS since July 1998. The universe of organizations contained in these files is similar (but not identical) to the universe in the Core public charity files but the Digitized Data includes hundreds of additional variables unavailable in the Core files. At present all files are version 2005b, covering fiscal years 1998 through 2003. Detailed technical information on the files can be found at here.
The UDAO and Master File • The Unified Database of Arts Organizations is a master list of organizations that includes commercial, nonprofit, and governmental organizations. Some are primarily arts organizations; others have programs in the arts but may other primary activities. The UDAO can be linked to other parts of the NCCS data system. • The Master File is a cumulative list of ALL exempt organizations from the Business Master Files from 1989 to the present. It is primarily used to locate the Employer Identification Number (EIN) for and organization when only the organization's name is known. Some fields which appear in the Business Master File are unavailable for older organizations. Additional NCCS Master files provide full listings of organizations' NTEEs and religious auspice codes.
IRS Form 990 • Form 990 is an annual reporting return that certain federally tax-exempt organizations must file with the IRS. It provides information on the filing organization's mission, programs, and finances.
Example Record • Here’s part of a record for The Urban Institute from the Core Data so you can get an idea of what information the data contains:
Data Dictionaries • There are also data dictionaries for every data set that provide detailed codes and descriptions (http://www.nccsdataweb.urban.org/PubApps/showDD.php):
Getting Started • The Data Web home page includes a series of three drop down menus across the top.
Help Screens • Every page has a Tips button that links to tips on how to use the tools and data sets that are available there.
Navigating the Data • The Drop Down menus across the top allow you to browse data sets or any items on a page in more or less detail.
Report Builder • Create simple summaries or more detailed cross-tabs and hierarchical tables. • For example, create a report of the number and assets of organizations in each state • From the first drop down select “Report Builder” • From the second drop down select the type of file (e.g. Core File, Business Master File) • From the third drop down select the year of the file you want to use • Select “Go” • Select the type of report: in this case a “One Variable” table • Enter the variable name: STATE • Select “Next” • Select “Next” • Select the variable, ASSETS • Select “Show report” • Hints: • If you’re not sure what type of report hold your mouse over the types (shown in orange text) for an example of the output • Not sure what the variable name is?Select the “Pick variable” button
Report Builder: Output • Output from the example a report: The number and assets of organizations in each state
Table Browser • View custom tables of information for organizations of interest.
Statistics • Examine summary statistics of specific variables to gain insight into data ranges and distributions.
Regression / ANOVA • Run preliminary analyses to evaluate trends and formulate ideas for further exploration.
Extract Data • Extract data for further analysis and load into statistical package of your choice. • Data downloads are only available for purchase.
Research Example • How are the expenses of health organizations varying over time? • What are some factors affecting these changes? • How much can we generalize these findings? • Let’s start by looking at the distribution of expenses. • Go to the tool selector box in the table of contents and select ‘Statistics’. • Next, in the data sets area of the table of contents, go to Core Data > Public Charities > Core 2006 PC and fill in the boxes as follows by typing or using the ‘Pick variable…’ boxes:
Expense Statistics • Click ‘Go’ and you will get this output: • In addition to the quantiles shown here, you will get a breakdown by quintiles and deciles. • Note the number of null, or missing, records, observations with a value of 0, and the distribution of the variable. • In this case, health organizations do not have many observations of 0 for expenses, but there are some negative values.
Expenses over time • Now let’s build a report of expenses over time to get an idea of the recent trend. • Select ‘Report Builder’ from the tool selector box. • Navigate to Core Trend v2007a PC in the data sets area and fill in the boxes as shown below: • When this is complete, click ‘>>(N)ext’.
Classifying Expenses • Next we need to assign data classes to the variable by typing in ranges. Let’s use the quartiles we calculated in the Statistics step. Click ‘>>(N)ext’ when you’re done.
Classifying File Years • Since we’re interested in the trend of expenses over time, we can leave the ‘Fileyear’ variable alone rather than re-classifying it. So, leave ‘Use the normal values of this variable’ checked.
Columns and Calculations • We won’t create any additional columns or run calculations in this example, so you can leave this page as is and click ‘>>(N)ext’.
Report Options • The ‘Options’ page allows us to give our report a title, sub-title, and control for how the variables and information are presented. • Give your report a name that makes sense to you and be sure to check ‘Show percentages by second variable…’ so that we can compare over time. There are additional options if you scroll further down on the page.
Data Filter • A data filter is an expression that selects only the subset of the data in which we are interested. Remember: we’re looking at health organizations. • In the ‘NTEE1’ field, which stands for the National Taxonomy of Exempt Entities code, select ‘Health’ so that we get only health organizations. Then go ahead and click ‘>|Show (R)eport’.
Report Output • After all of these steps, here’s a portion of the final report we’ll get: • Notice the increase in the proportion of organizations in the top quartile. Which of the other quartiles are feeding this increase the most?
Regression Analysis • Now that we have an idea of the trends occurring in expenses for health organizations, let’s examine some possible contributing factors. • We’ll test the effect that rental expenses had on overall expenses for health organizations. Select ‘Regression / ANOVA’ from the data tool selector and choose ‘Core 2006 PC’. • We want to predict the value of expenses using rental expenses, which looks like this:
Regression Output • The analysis gives us the following result: • So, there is a correlation between total expenses and rental expenses for health organizations, but it is not very strong. Can you think of some other predictors?
Extracting Data • We’ve done some simple analysis, but chances are you’ll want to do some more in-depth analyses, so let’s extract some data for further exploration. • Go to ‘Extract Data’ in the tool selector and stay with the ‘Core 2006 PC’ data file. • Start off by selecting the variables you need. We’ll want the ‘Basic Info’ section, ‘Part I: Revenue, Expenses, and Changes in Net Assets or Fund Balances’, and ‘Part II: Expenses’.
Filtering the Data Extract • Just as we did while creating our report and running the regression analysis, we want to select only records for health organizations, so be sure to fill in the ‘Select records’ section appropriately.
Extract Format • Lastly, let’s select a data format for our extract. There are several options for statistical packages such as SAS, Stata, and SPSS, but let’s stick with a generic format so that our data extract can be used with any of these programs. • Once you’ve selected a format you like, go ahead and click ‘Extract Data’. You can also set up an e-mail notification if you like.