Download

1 / 55
560 likes | 832 Views
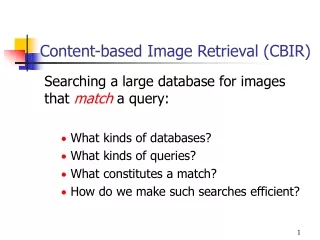
Content-based Image Retrieval (CBIR). Searching a large database for images that match a query: What kinds of databases? What kinds of queries? What constitutes a match? How do we make such searches efficient?. Applications. Art Collections e.g. Fine Arts Museum of San Francisco

E N D
Content-based Image Retrieval (CBIR) Searching a large database for images that match a query: • What kinds of databases? • What kinds of queries? • What constitutes a match? • How do we make such searches efficient?
Applications • Art Collections e.g. Fine Arts Museum of San Francisco • Medical Image Databases CT, MRI, Ultrasound, The Visible Human • Scientific Databases e.g. Earth Sciences • General Image Collections for Licensing Corbis, Getty Images • The World Wide Web
What is a Query? • an image you already have How did you get it? • a rough sketch you draw How might you draw it? • a symbolic description of what you want What’s an example?
Some Systems You Can Try Corbis Stock Photography and Pictures http://pro.corbis.com/ • Corbis sells high-quality images for use in advertising, • marketing, illustrating, etc. • Search is entirely by keywords. • Human indexers look at each new image and enter keywords. • A thesaurus constructed from user queries is used.
QBIC IBM’s QBIC (Query by Image Content) http://wwwqbic.almaden.ibm.com • The first commercial system. • Uses or has-used color percentages, color layout, • texture, shape, location, and keywords.
Blobworld UC Berkeley’s Blobworld http://elib.cs.berkeley.edu/blobworld • Images are segmented on color plus texture • User selects a region of the query image • System returns images with similar regions • Works really well for tigers and zebras
Like.com Like.com http://www.like.com • Small company • Search for products similar to a selected one Purses, shoes, sunglasses, jewelry…..
Feature Space Images Image Features / Distance Measures Query Image Retrieved Images User Image Database Distance Measure Image Feature Extraction
Features • Color (histograms, gridded layout, wavelets) • Texture (Laws, Gabor filters, LBP, polarity) • Shape (What preprocessing must occur to get shape?) • Objects and their Relationships • This is the most powerful, but you have to be able to • recognize the objects!
QBIC’s Histogram Similarity The QBIC color histogram distance is: dhist(I,Q) = (h(I) - h(Q)) A (h(I) - h(Q)) T • h(I) is a K-bin histogram of a database image • h(Q) is a K-bin histogram of the query image • A is a K x K similarity matrix
Similarity Matrix RGBYCV 1 0 0 .5 0 .5 0 1 0 .5 .5 0 0 0 1 1 1 1 R G B Y C V ? How similar is blue to cyan? ?
Gridded Color Gridded color distance is the sum of the color distances in each of the corresponding grid squares. 2 2 1 1 3 4 3 4 What color distance would you use for a pair of grid squares?
Texture Distances • Pick and Click (user clicks on a pixel and system • retrieves images that have in them a region with • similar texture to the region surrounding it. • Gridded (just like gridded color, but use texture). • Histogram-based (e.g. compare the LBP histograms).
Shape Distances • Shape goes one step further than color and texture. • It requires identification of regions to compare. • There have been many shape similarity measures • suggested for pattern recognition that can be used • to construct shape distance measures.
Global Shape Properties:Projection Matching 0 4 1 3 2 0 Feature Vector (0,4,1,3,2,0,0,4,3,2,1,0) 0 4 3 2 1 0 In projection matching, the horizontal and vertical projections form a histogram. What are the weaknesses of this method? strengths?
Global Shape Properties:Tangent-Angle Histograms 135 0 30 45 135 Is this feature invariant to starting point? Is it invariant to size, translation, rotation?
Boundary Matching • Fourier Descriptors • Sides and Angles • Elastic Matching The distance between query shape and image shape has two components: 1. energy required to deform the query shape into one that best matches the image shape 2. a measure of how well the deformed query matches the image
Del Bimbo Elastic Shape Matching query retrieved images
Regions and Relationships • Segment the image into regions • Find their properties and interrelationships • Construct a graph representation with • nodes for regions and edges for • spatial relationships • Use graph matching to compare images Like what?
Tiger Image as a Graph sky image above adjacent above inside tiger grass above adjacent above sand abstract regions
Object Detection: Rowley’s Face Finder 1. convert to gray scale 2. normalize for lighting* 3. histogram equalization 4. apply neural net(s) trained on 16K images What data is fed to the classifier? 32 x 32 windows in a pyramid structure * Like first step in Laws algorithm, p. 220
Fleck and Forsyth’s Flesh Detector The “Finding Naked People” Paper • Convert RGB to HSI • Use the intensity component to compute a texture map • texture = med2 ( | I - med1(I) | ) • If a pixel falls into either of the following ranges, • it’s a potential skin pixel • texture < 5, 110 < hue < 150, 20 < saturation < 60 • texture < 5, 130 < hue < 170, 30 < saturation < 130 median filters of radii 4 and 6 Look for LARGE areas that satisfy this to identify pornography.
Wavelet Approach Idea: use a wavelet decomposition to represent images • What are wavelets? • compression scheme • uses a set of 2D basis functions • representation is a set of coefficients, one for • each basis function
Jacobs, Finkelstein, Salesin Methodfor Image Retrieval (1995) 1. Use YIQ color space 2. Use Haar wavelets 3. 128 x 128 images yield 16,384 coefficients x 3 color channels 4. Truncate by keeping the 40-60 largest coefficients (make the rest 0) 5. Quantize to 2 values (+1 for positive, -1 for negative)
Experiments 20,558 image database of paintings 20 coefficients used User “paints” a rough version of the painting he /she wants on the screen. See Video
Andy Berman’s FIDS System • multiple distance measures • Boolean and linear combinations • efficient indexing using images as keys
Andy Berman’s FIDS System: Use of key images and the triangle inequality for efficient retrieval.
Andy Berman’s FIDS System: Bare-Bones Triangle Inequality Algorithm Offline 1. Choose a small set of key images 2. Store distances from database images to keys Online (given query Q) 1. Compute the distance from Q to each key 2. Obtain lower bounds on distances to database images 3. Threshold or return all images in order of lower bounds
Andy Berman’s FIDS System: Bare-Bones Algorithm with Multiple Distance Measures Offline 1. Choose key images for each measure 2. Store distances from database images to keys for all measures Online (given query Q) 1. Calculate lower bounds for each measure 2. Combine to form lower bounds for composite measures 3. Continue as in single measure algorithm
Andy Berman’s FIDS System: Performance on a Pentium Pro 200-mHz Step 1. Extract features from query image. (.02s t .25s) Step 2. Calculate distance from query to key images. (1s t .8ms) Step 3. Calculate lower bound distances. (t 4ms per 1000 images using 35 keys, which is about 250,000 images per second.) Step 4. Return the images with smallest lower bound distances.
Demo of FIDS • http://www.cs.washington/research/imagedatabase/demo
Weakness of Low-level Features • Can’t capture the high-level concepts
Research Objective Query Image Retrieved Images User boat Image Database … • Animals • Buildings • Office Buildings • Houses • Transportation • Boats • Vehicles … Object-oriented Feature Extraction Images Categories
Overall Approach • Develop object recognizers for common objects • Use these recognizers to design a new set of both • low- and mid-level features • Design a learning system that can use these • features to recognize classes of objects
Building Features: Consistent Line Clusters (CLC) • A Consistent Line Cluster is a set of lines that are homogeneous in terms of some line features. Color-CLC:The lines have the same color feature. Orientation-CLC: The lines are parallel to each other or converge to a common vanishing point. Spatially-CLC: The lines are in close proximity to each other.
Color-CLC • Color feature of lines: color pair (c1,c2) • Color pair space: RGB (2563*2563) Too big! Dominant colors (20*20) • Finding the color pairs: One line Several color pairs • Constructing Color-CLC: use clustering
Orientation-CLC • The lines in an Orientation-CLC are parallel to each other in the 3D world • The parallel lines of an object in a 2D image can be: • Parallel in 2D • Converging to a vanishing point (perspective)
Spatially-CLC • Vertical position clustering • Horizontal position clustering
Building Recognition by CLC Two types of buildings Two criteria • Inter-relationship criterion • Intra-relationship criterion
Experimental Evaluation • Object Recognition • 97 well-patterned buildings (bp): 97/97 • 44 not well-patterned buildings (bnp): 42/44 • 16 not patterned non-buildings (nbnp): 15/16 (one false positive) • 25 patterned non-buildings (nbp): 0/25 • CBIR