Download

1 / 51
510 likes | 652 Views
Louisville by the Numbers Recent Trends in Population, Households, and Housing Sales and Marketing Council Home Builders Association of Louisville Michael Price Kentucky State Data Center University of Louisville Louisville, Kentucky June 14, 2012. America’s New Regions. New Sunbelt.

E N D
Louisville by the Numbers Recent Trends in Population, Households, and Housing Sales and Marketing Council Home Builders Association of Louisville Michael Price Kentucky State Data Center University of Louisville Louisville, Kentucky June 14, 2012
America’s New Regions New Sunbelt Melting Pot Heartland States Source: William H. Frey
America’s New Demographic Regions Migration growth states The New Sunbelt Diversity states Melting Pot America Slow growth states The Heartland
New Sunbelt New Sunbelt: Examples Colorado Georgia Immigration Domestic Migration Natural Increase Source: William Frey.
Melting Pot Melting Pot: Examples New York California Immigration Domestic Migration Natural Increase Source: William Frey.
Immigration Domestic Migration Natural Increase Heartland Heartland: Examples Kentucky Pennsylvania Source: William Frey & Michael Price
Kentucky 2010 Census Results Number Change in Population by County 2000 - 2010 State population count change: 297,598
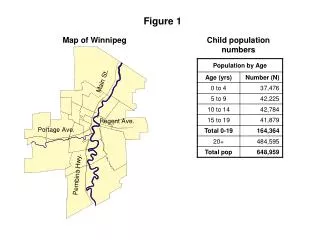
Largest growing counties • Jefferson (47,492) • Fayette (35,291) • Boone (32,820) • Warren (21,270) • Oldham (14,138)
Fastest growing counties • Spencer (45%) • Scott (43%) • Boone (38%) • Oldham (31%)
On the downside • 36 counties lost population. • 27 counties grew by less than 4%. • 88 counties grew slower than the state.
Biggest Losers • Harlan (-3,924) • Pike (-3,712) • Floyd (-2,990) • Clay (-2,826)
Fastest Losers • Breathitt (-14%) • Fulton (-12%) • Harlan (-12%) • Clay (-12%)
Population Growth in Kentucky Metro Areas Percent Change 2000-2010
Louisville MSA Population Growth 2000-2010 (121,682) Jefferson (47,138) Clark (13,851) Oldham (14,138) Trimble (684) Washington (1,039) Henry (356) Harrison (5,039) Shelby (8,737) Floyd (3,755) Spencer (5,295) Meade (2,253) Bullitt (13,083) Nelson (5,960)
Louisville MSA Total Population 2010 1,283,557 Spencer Trimble Henry Washington 28,262 Meade 28,608 17,061 15,416 8,809 Harrison 39,364 Shelby 42,074 Nelson 43,437 Oldham 60,316 Bullitt 74,319 Louisville/Jefferson 741,096 Floyd 74,578 Clark 110,323
Percent Change in Population 2000 - 2010
Louisville MSA Counties Percent Change in Population 2000 - 2010
Louisville MSA Counties Population Growth 2000 - 2010
Annual Rates of Population Growth United States Percent Change Louisville MSA Louisville/Jefferson County Preliminary estimates by Michael Price
Louisville/Jefferson County Components of Population Growth Natural Increase Net International Migration Net Domestic Migration Preliminary estimates by Michael Price
Household Size Occupancy-Vacancy Population (in households) Households Housing Units
Louisville/Jefferson County 1960-2010 Household Population Housing Units Households Source: U.S. Census Bureau, Decennial Census 1960-2000 and 2009 American Community Survey.
Louisville/Jefferson County Decennial Growth Rates 1960’s 1970’s 1980’s 1990’s 2000’s
Louisville/Jefferson County Vacant Housing Percent of total housing units not occupied American Community Survey 2010 Census
Louisville/Jefferson County Percent Owner-Occupied Households
Louisville/Jefferson County Population growth by race and Hispanic origin 2000 - 2010 White, not Hispanic *Race categories exclude Hispanics.
Louisville/Jefferson County Percent change in population by race and Hispanic origin 2000 - 2010 White, not Hispanic 163.1% *Race categories exclude Hispanics.
From 2000 to 2010, • Jefferson County population grew by 47,492. • 16% of state total population growth • 57% of state Black population growth • 35% of state Asian population growth • 28% of state Hispanic population growth
Louisville/Jefferson County Black – White Segregation Index
Median Family Income 2000
Median Family Income 2005/2009
Change in Median Family Income 2000 – 2005/2009 Actual dollars (no adjustment for inflation)
Median value of owner-occupied housing 2005/2009
Change in median house value 2000 – 2005/2009 Change in actual dollars (no adjustment for inflations)
peak: 628,000 drop of 7.0% drop in last recession of 4.5% December, 2010: 586,000 ….but note that employment took 3 years to turn up after last downturn Source: Dr. Paul Coomes
MSA Total Employment Growth 2001 - 2007 Percent Change U.S. Bureau of Labor Statistics
MSA Total Employment Growth 2007 – June 2010 (P) Percent Change U.S. Bureau of Labor Statistics